Steem Total Value Powered Up - $28 million - June 11, 2023
This is next in my series of posts reviewing the amount and value of powered up STEEM on the Steem blockchain. For previous posts, see the end of this entry.
Noteworthy in the last week |
|---|
- The 28-day average of completed powerdowns is at the lowest level since I started collecting data.
- Week over week, the number of powered up STEEM increased by about 500 thousand SP, or 0.29%.
- Over the course of the week, we saw six daily increases and six new highs in the number of staked STEEM.
- The modeled value of powered-up (staked) STEEM lost ground against all comparison values, except for TRX and LTC.
- Changes ranged from -14 1/2% against USD to +5 3/4% against LTC.
- Compared to the January 1, 2023 baseline, the modeled value has lost ground against BTC, ETH, and TRX. It has gained ground against LTC, SBD, and USD.
- This week's completed powerdowns were reported at 284K, which is an increase of about 22% from last week's 233K.
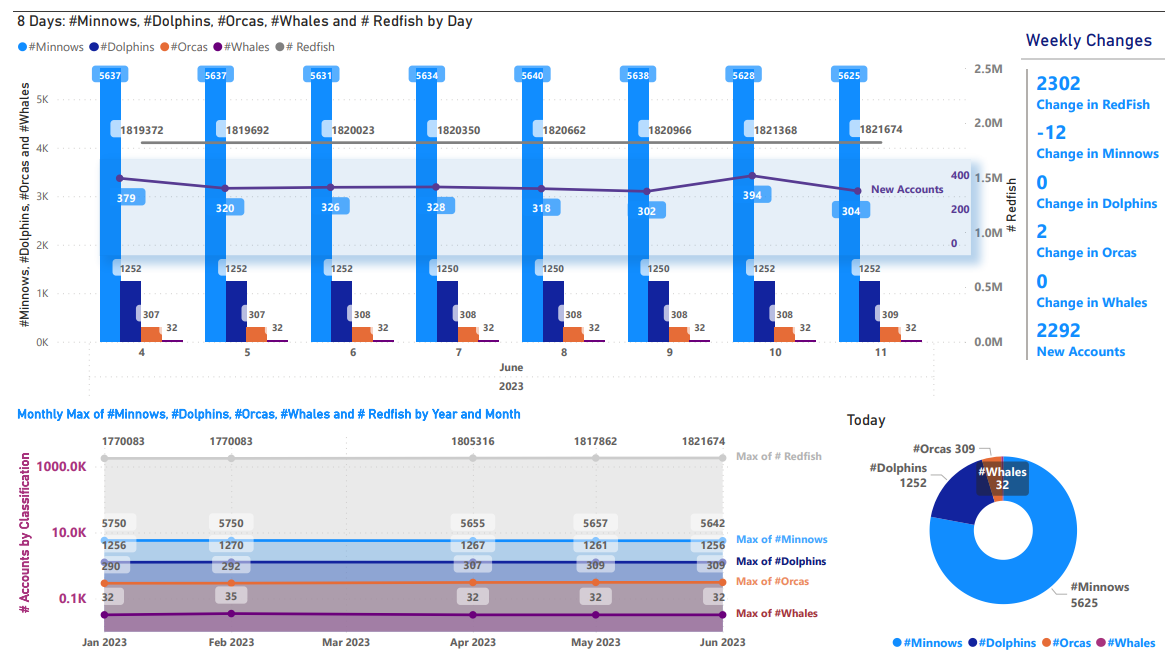
- We saw 2,292 new accounts created - down from 2,787 last week.
- Net migrations of account classifications showed 2 more orcas, 12 fewer minnows, and 10 additional redfish.
- Crypto-markets, especially altcoins, were riled this week by SEC actions against Binance's US subsidiary and Coinbase.
Here are the numbers as-of a few minutes ago |
|---|
Total value locked in powered-up STEEM (USD): $27,896,163.16
External STEEM market cap (coingecko) $69,619,426.46
Internal STEEM market cap (median_price * current_supply) $75,901,000.00
Locked value in terms of other tokens:
| token | price | locked value equivalent | Jan 1, 2023 | pct of Jan 1 baseline |
|---|---|---|---|---|
| tron | $0.07 | 402,083,673 | 445,758,870 | 90.20% |
| steem-dollars | $2.08 | 13,411,616 | 11,564,498 | 115.97% |
| bitcoin | $25,761.00 | 1,082 | 1,477 | 73.29% |
| ethereum | $1,745.38 | 15,982 | 20,406 | 78.32% |
| litecoin | $77.75 | 358,793 | 344,287 | 104.21% |
| steem | $0.16 | 175,216,150 | 166,882,703 | 104.99% |
| USD | $1.00 | 27,896,163 | 24,516,738 | 113.78% |
|
|---|
This slide (new after April 16) takes its data from steemchiller's SDS getVestingStats API call.
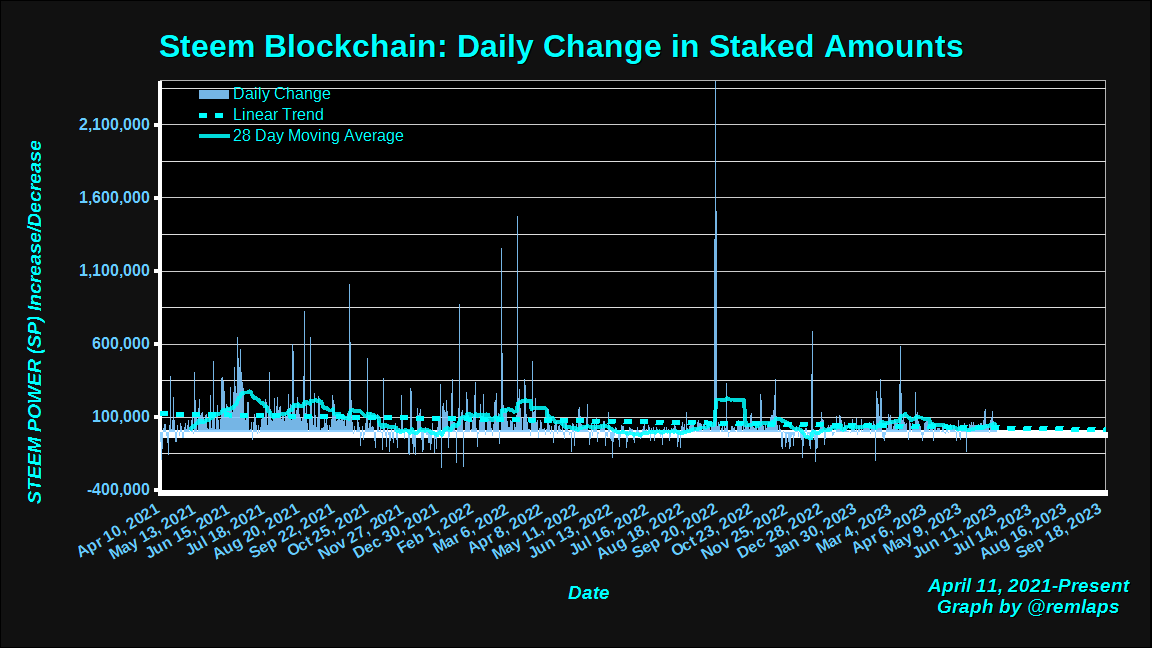
Daily Changes
Here is a chart of daily changes in powered-up STEEM from April 11, 2021 to present. The graph also includes a linear trend line and a 28 day moving average.
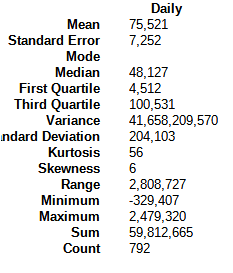
Here are some descriptive statistics, for numbers geeks.
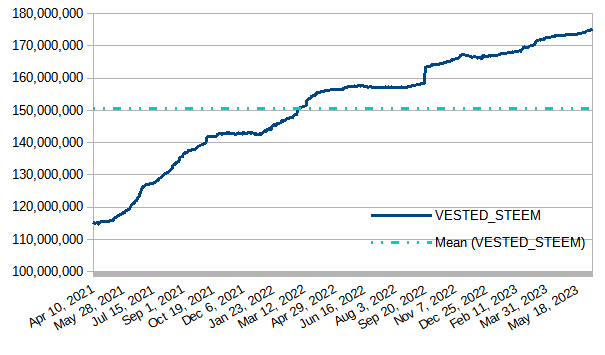
VESTED STEEM
Today's downloaded value was 175,207,890, which is up by about 500K STEEM, or about 3/10% from last week's observed value. The graph continues to show a slight upslope.
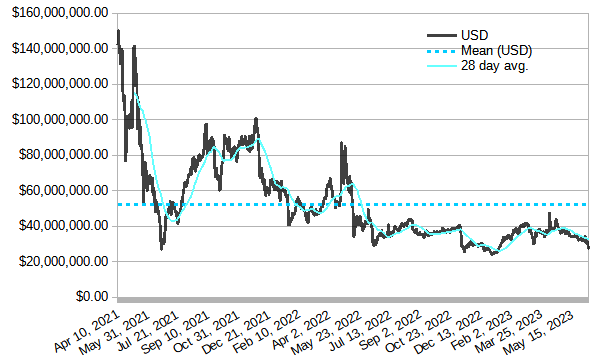
Modeled value of powered-up STEEM in terms of USD
In terms of USD, today's value at download time - a bit under $28 million - remains higher than the December 30, 2022 low of $23,718,335.58. It lost about $4.8 million or nearly 14 1/2% from last week's value.
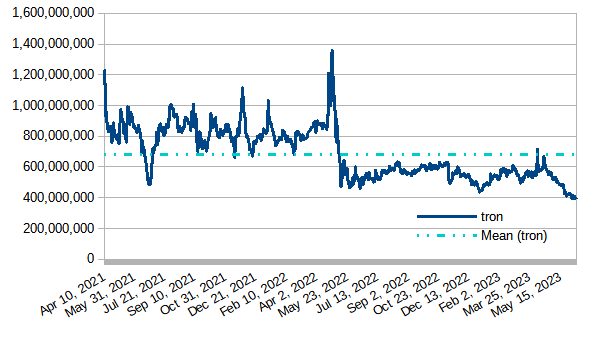
Modeled value of powered-up STEEM in terms of Tron (TRX)
Powered-up STEEM bounced off of its all-time lows against TRX, advancing by about 3.4 million tokens or a bit more than 3/4%.
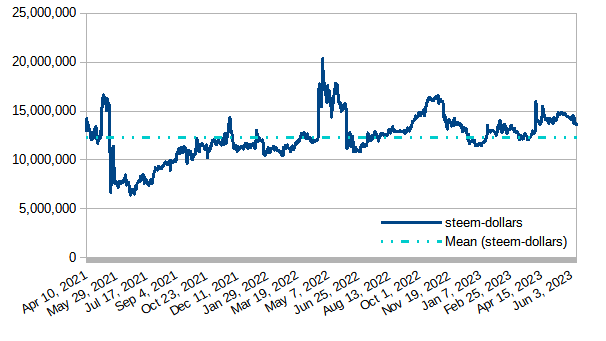
Modeled value of powered-up STEEM in terms of Steem Dollars
Powered-up STEEM declined by about 890K SBDs, approximately 6 1/5%, during the last week.
Modeled value of powered-up STEEM as a percentage of Steem's market cap
With today's observed value of 40.28% the graph continues to straddle the 40% line again this week, but the last 4 days have all been above that threshold. We have now seen 4 days above 40%; 433 consecutive days above 39%; 497 consecutive days above 37%; 624 consecutive days above 35%; and 687 straight days above 1/3.
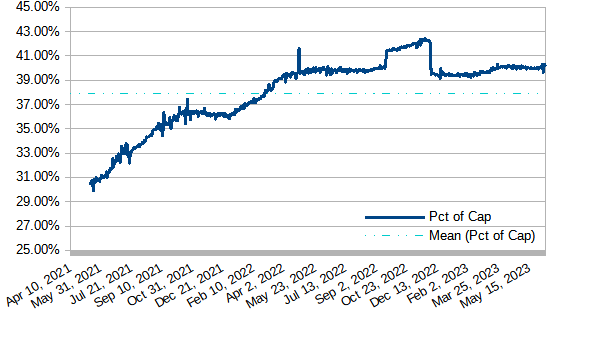
*As previously reported, the big drop on December 4, 2022 was due to a correction in the value that Coingecko is getting for its circulating supply. Numbers before December 4, 2022 were based on an artificially low supply measurement.
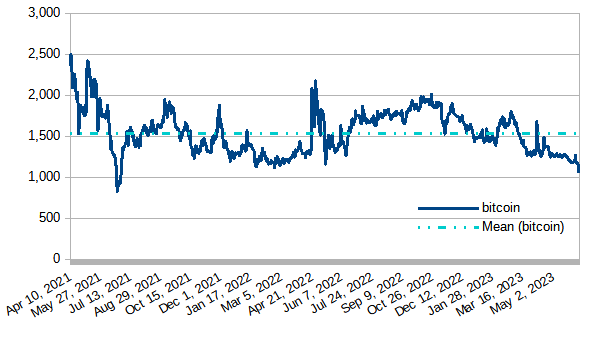
Modeled value of powered-up STEEM in terms of bitcoin (BTC)
Powered-up STEEM declined by about 114 BTC, or roughly 9 1/2%.
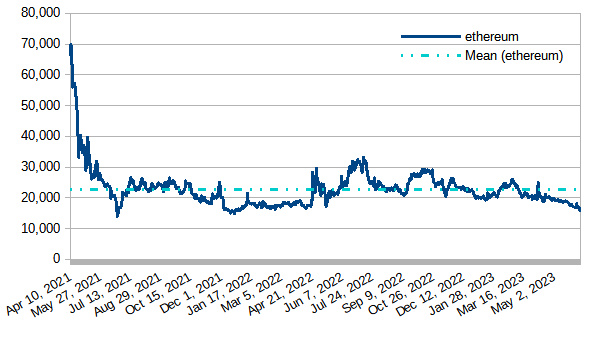
Modeled value of powered-up STEEM in terms of Ethereum
Powered-up STEEM declined in the last seven days by about 1,100 ETH, or a little over 6 1/2%.
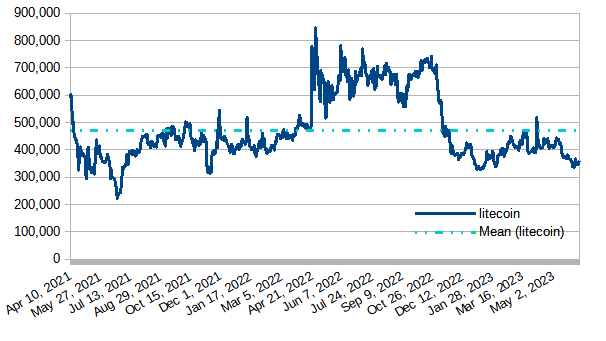
Modeled value of powered-up STEEM in terms of LTC
In the last 7 days, powered-up STEEM advanced against LTC by almost 20K LTC, which is about 5 3/4%.
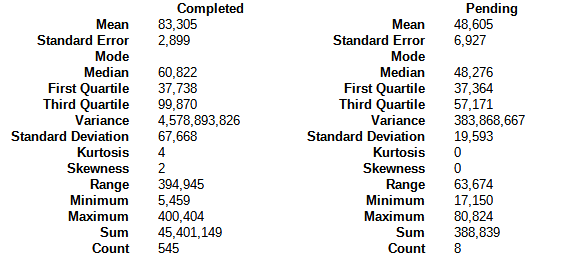
Daily Powerdown Activity
Here is graph with data from steemdb.io to show daily completed and pending powerdown activity. The graph shows 284K in completed powerdowns last week and 395K pending (both measured from Sunday through Saturday[GMT time zone]). This represents a potential increase in powerdowns by about 39% or less. The 28-day moving average line appears to have reached an all-time low (since Dec/2021).
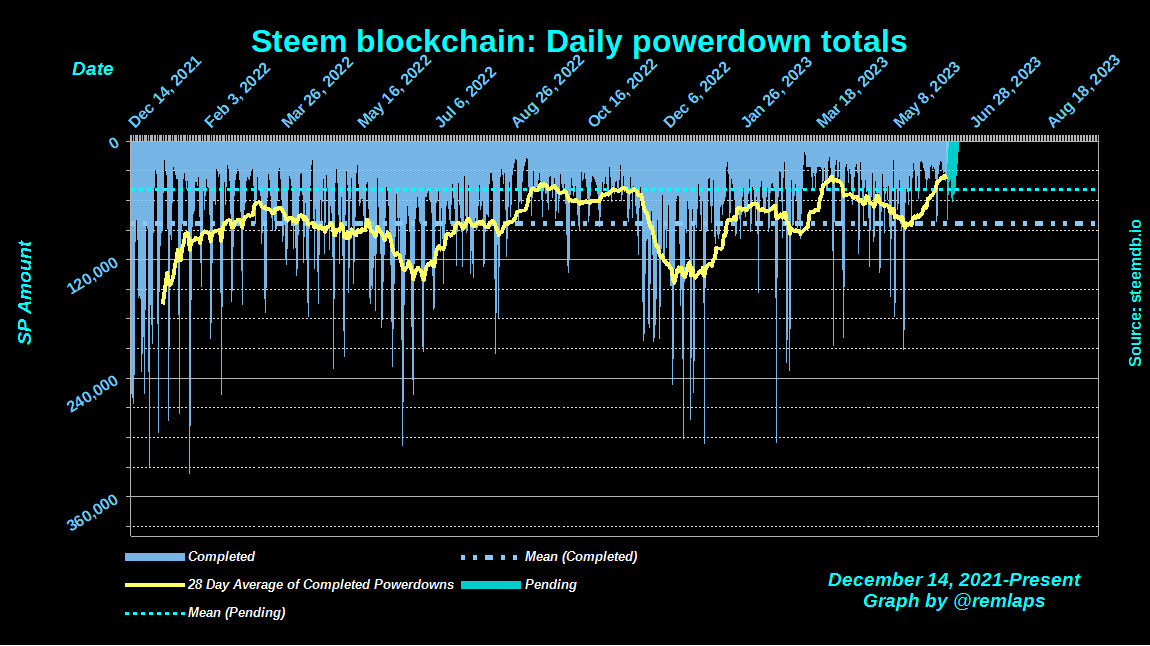
The horizontal lines are the average values for completed (blue) and pending (cyan) powerdowns, and the yellow line is a 28 day moving average of completed powerdowns. "Pending" numbers now come from the Steemit API, not from steemdb.io.
Here are some descriptive statistics for the numbers geeks
| And with a total of 1,091 pending power downs (up from 946 last week), here are the times, dates, and amounts of the top-10 |
|---|
1 2023-06-11T22:40:24 - 132,468,434 VESTS, 75,168 STEEM
2 2023-06-14T00:15:18 - 76,398,829 VESTS, 43,352 STEEM
3 2023-06-16T12:44:03 - 38,787,328 VESTS, 22,010 STEEM
4 2023-06-12T05:01:36 - 25,607,140 VESTS, 14,531 STEEM
5 2023-06-17T02:36:12 - 22,043,053 VESTS, 12,508 STEEM
6 2023-06-13T02:02:09 - 21,994,546 VESTS, 12,481 STEEM
7 2023-06-15T05:43:24 - 21,010,234 VESTS, 11,922 STEEM
8 2023-06-16T02:13:54 - 16,837,768 VESTS, 9,554 STEEM
9 2023-06-15T12:50:03 - 16,331,963 VESTS, 9,267 STEEM
10 2023-06-15T20:18:30 - 15,864,029 VESTS, 9,002 STEEM
Notes
- Reference prices for STEEM and other tokens are downloaded from coingecko.com
Previous posts
- Steem Total Value Powered Up - $28 million - June 11, 2023
- Steem Total Value Powered Up - $33 million - June 4, 2023
- Steem Total Value Powered Up - $33 million - May 28, 2023
- Steem Total Value Powered Up - $34 million - May 21, 2023
- Steem Total Value Powered Up - $34 million - May 14, 2023
- Steem Total Value Powered Up - $37 million - May 7, 2023
- Steem Total Value Powered Up - $38 million - April 30, 2023
- Steem Total Value Powered Up - $38 million - April 23, 2023
- Steem Total Value Powered Up - $41 million - April 16, 2023
- Steem Total Value Powered Up - $38 million - April 9, 2023
- Steem Total Value Powered Up - $36 million - April 2, 2023
- Steem Total Value Powered Up - $37 million - March 26, 2023
- Steem Total Value Powered Up - $38 million - March 19, 2023
- Steem Total Value Powered Up - $31 million - March 12, 2023
- Steem Total Value Powered Up - $37 million - March 5, 2023
- Steem Total Value Powered Up - $41 million - February 26, 2023
- Steem Total Value Powered Up - $40 million - February 19, 2023
- Steem Total Value Powered Up - $38 million - February 12, 2023
- Steem Total Value Powered Up - $36 million - February 5, 2023
- Steem Total Value Powered Up - $35 million - January 29, 2023
- Steem Total Value Powered Up - $33 million - January 22, 2023
- Steem Total Value Powered Up - $30 million - January 15, 2023
- Steem Total Value Powered Up - $25 million - January 8, 2023
- Steem Total Value Powered Up - $24 million - January 1, 2023
For links from 2021 and 2022, see these posts:
- Steem Total Value Powered Up - $67 million - January 2,
20212022 - Steem Total Value Powered Up - $36 million - June 26, 2022
- Steem Total Value Powered Up - $26 million - December 18, 2022

Pixabay license, source
Reminder
Visit the /promoted page and #burnsteem25 to support the inflation-fighters who are helping to enable decentralized regulation of Steem token supply growth.
It can be seen that this value, 28 million - June 11, 2023, is the third lowest so far this year, and with respect to the $ 35 million June 11, 2022, there is a difference of $ 7 million. This year's average is $34.7 million. It should be noted that the $ 35 million June 11, 2022, were the first lowest until that date. Thanks for the data.
Thanks for the analysis. There has been an increase in the rate of steem power compared to last week, which is pleasing.
Recently, the entire cryptocurrency collapsed into the abyss, but nothing terrible happened. Now, little by little, everything is coming back. I hope the price will soon reach the usual values of our coin.