Steem Total Value Powered Up - $34 million - May 21, 2023
This is next in my series of posts reviewing the amount and value of powered up STEEM on the Steem blockchain. For previous posts, see the end of this entry.
Noteworthy in the last week |
|---|
- Week over week, the number of powered up STEEM increased by about 300 thousand SP, or 0.2%.
- Over the course of the week, we saw seven daily increases and three new highs in the number of staked STEEM.
- The modeled value of powered-up (staked) STEEM gained ground against all comparison values, except for LTC and TRX.
- Changes ranged from -7 1/3% against TRX to +1 1/2% against USD.
- Compared to the January 1, 2023 baseline, the modeled value is higher than all comparison tokens, except for
LTC and TRXBTC and ETH. - This week's completed powerdowns were reported at 329K, which is a decrease of about 61% from last week's 848K.
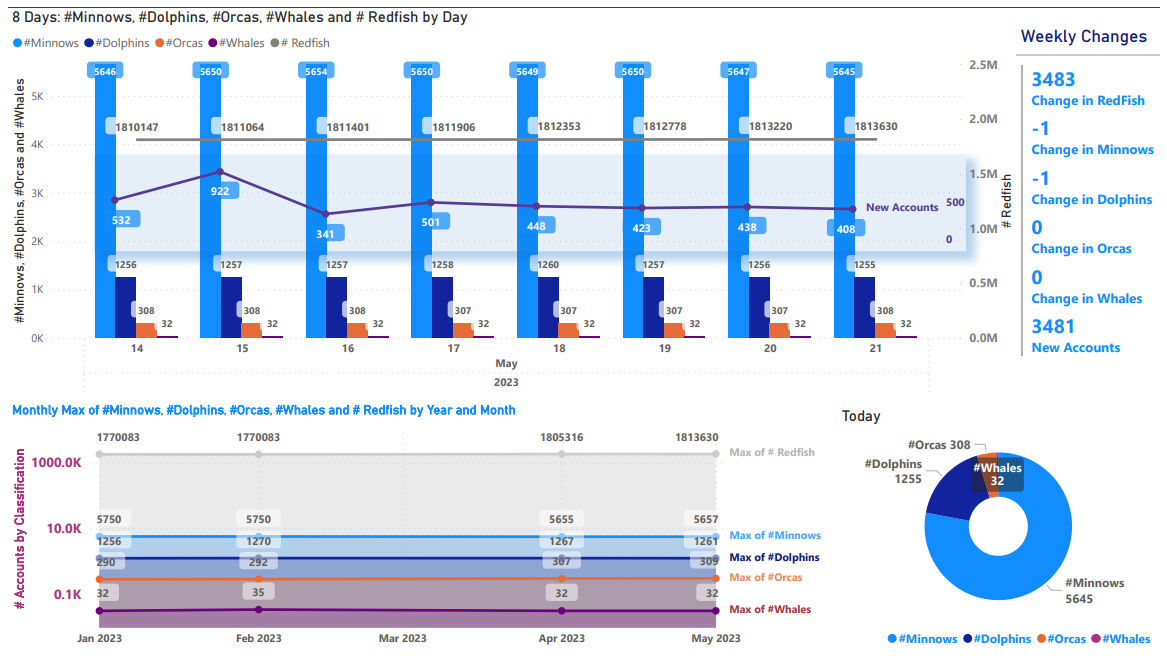
- We saw 3,481 new accounts created - up from 2,496 last week.
- Net migrations of account classifications showed one less dolphin, one less minnow, and two additional redfish.
Here are the numbers as-of a few minutes ago |
|---|
Total value locked in powered-up STEEM (USD): $34,121,373.61
External STEEM market cap (coingecko) $85,286,223.13
Internal STEEM market cap (median_price * current_supply) $85,171,000.00
Locked value in terms of other tokens:
| token | price | locked value equivalent | Jan 1, 2023 | pct of Jan 1 baseline |
|---|---|---|---|---|
| tron | $0.08 | 451,543,996 | 445,758,870 | 101.30% |
| steem-dollars | $2.32 | 14,707,488 | 11,564,498 | 127.18% |
| bitcoin | $26,911.00 | 1,267 | 1,477 | 85.82% |
| ethereum | $1,810.38 | 18,847 | 20,406 | 92.36% |
| litecoin | $91.60 | 372,504 | 344,287 | 108.20% |
| steem | $0.20 | 173,837,641 | 166,882,703 | 104.17% |
| USD | $1.00 | 34,121,374 | 24,516,738 | 139.18% |
|
|---|
This slide (new after April 16) takes its data from steemchiller's SDS getVestingStats API call. Because of a service disruption on Monday, the numbers on Monday and Tuesday are offset weirdly. Monday's number is artificially high, and Tuesday's is artificially low.
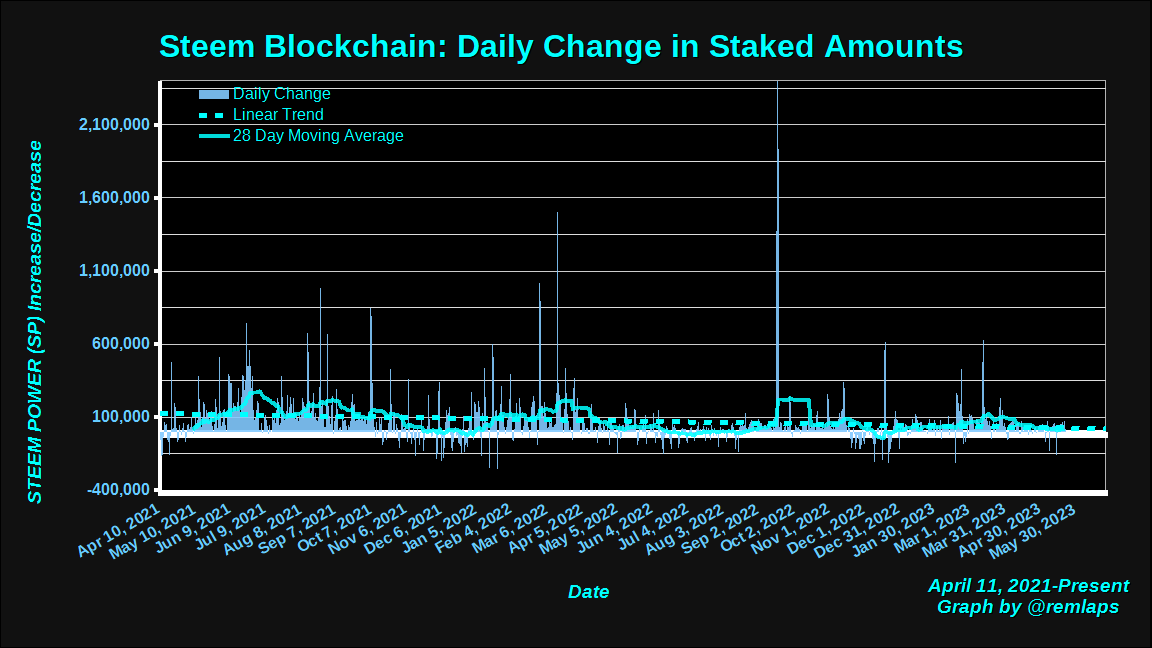
Daily Changes
Here is a chart of daily changes in powered-up STEEM from April 11, 2021 to present. The graph also includes a linear trend line and a 28 day moving average.
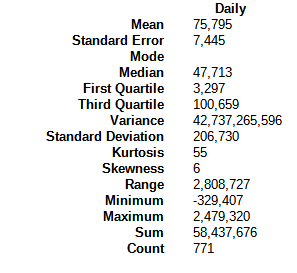
Here are some descriptive statistics, for numbers geeks.
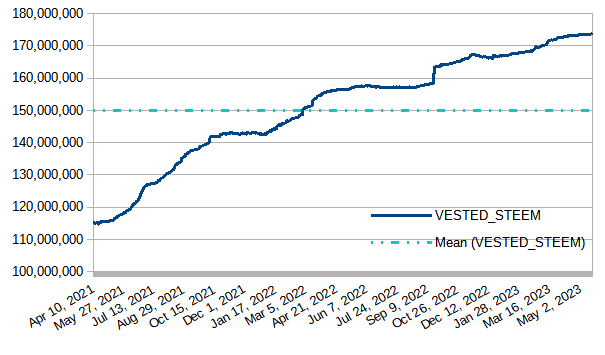
VESTED STEEM
Today's downloaded value was 173,832,901, which is up by about 300K STEEM, or about 1/5% from last week's observed value. The graph has remained almost flat.
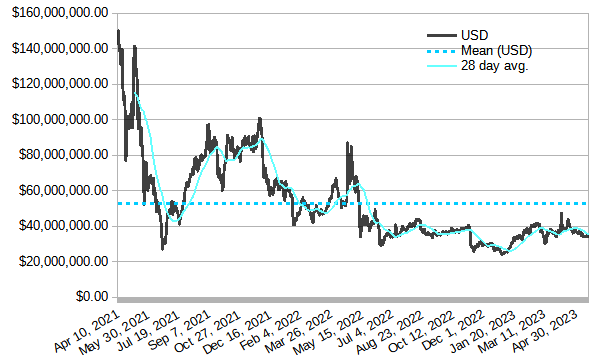
Modeled value of powered-up STEEM in terms of USD
In terms of USD, today's value at download time - slightly over $34 million - remains higher than the December 30, 2022 low of $23,718,335.58. It gained by about $1/2 million - or 1 1/2% from last week's value.
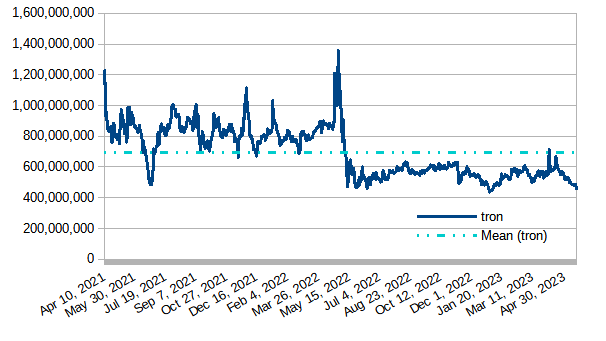
Modeled value of powered-up STEEM in terms of Tron (TRX)
Powered-up STEEM moved lower against TRX by about 36 million tokens or about 7 1/3%. Today's number - just shy of 450 million - is about 14 million above the all time low near 436 million. That low was logged on December 30, 2022.
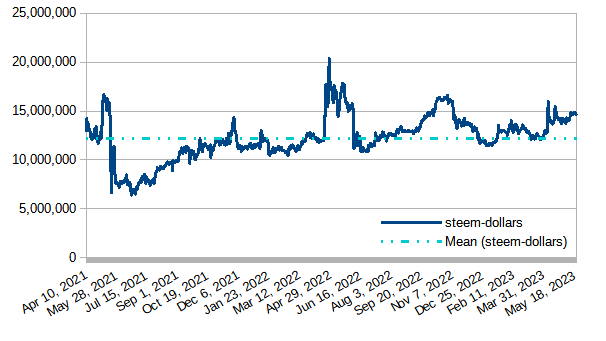
Modeled value of powered-up STEEM in terms of Steem Dollars
Powered-up STEEM gained ground by about 159K SBDs over the last week, which is about 1%.
Modeled value of powered-up STEEM as a percentage of Steem's market cap
After today's observed value of 39.99% the graph has continued flirting with the 40% line yet again this week. We have now seen 412 consecutive days above 39%; 476 consecutive days above 37%; 603 consecutive days above 35%; and 666 straight days above 1/3.
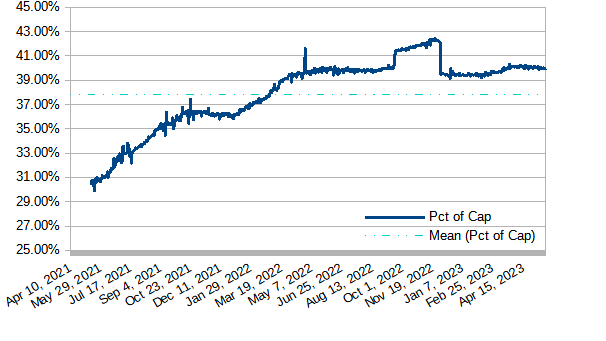
*As previously reported, the big drop on December 4, 2022 was due to a correction in the value that Coingecko is getting for its circulating supply. Numbers before December 4, 2022 were based on an artificially low supply measurement.
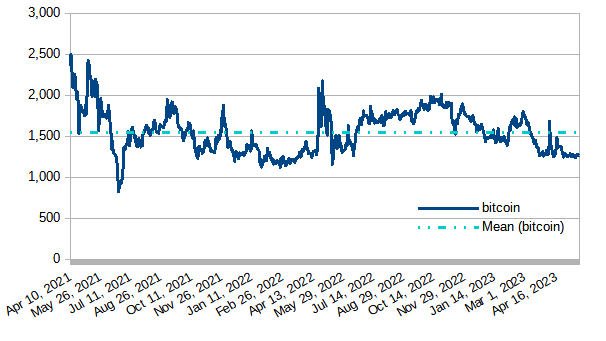
Modeled value of powered-up STEEM in terms of bitcoin (BTC)
Powered-up STEEM advanced by about 16 BTC, or roughly 1 1/3%.
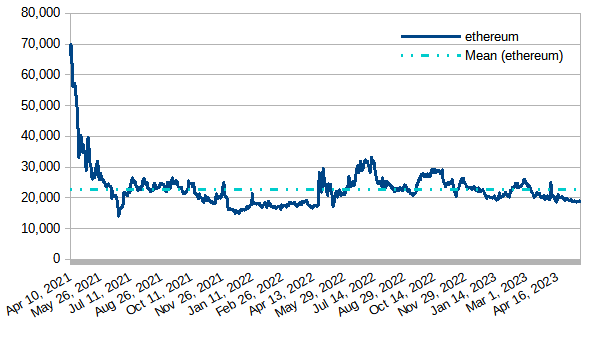
Modeled value of powered-up STEEM in terms of Ethereum
Powered-up STEEM advanced in the last seven days by 199 ETH, or a little over 1%.
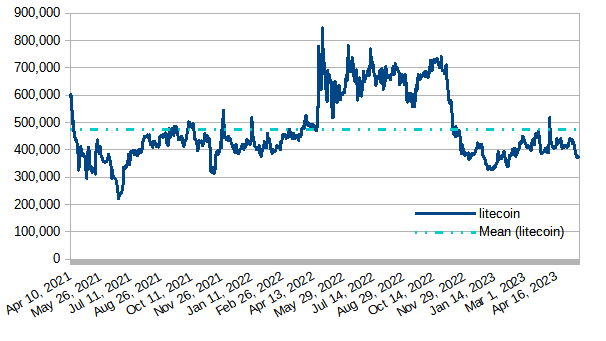
Modeled value of powered-up STEEM in terms of LTC
In the last 7 days, powered-up STEEM moved down against LTC by about 43K LTC, which is about 10 1/2%.
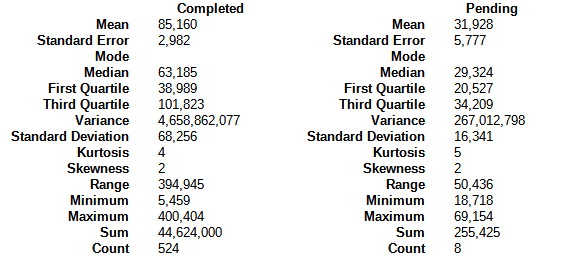
Daily Powerdown Activity
Here is graph with data from steemdb.io to show daily completed and pending powerdown activity. The graph shows 329K in completed powerdowns last week and 258K pending (both measured from Sunday through Saturday[GMT time zone]). This represents a potential decrease in powerdowns by about 21 1/2% or more. The completed powerdowns were down markedly from last week's pending number (541K) because at least one large pending powerdown was canceled before execution.
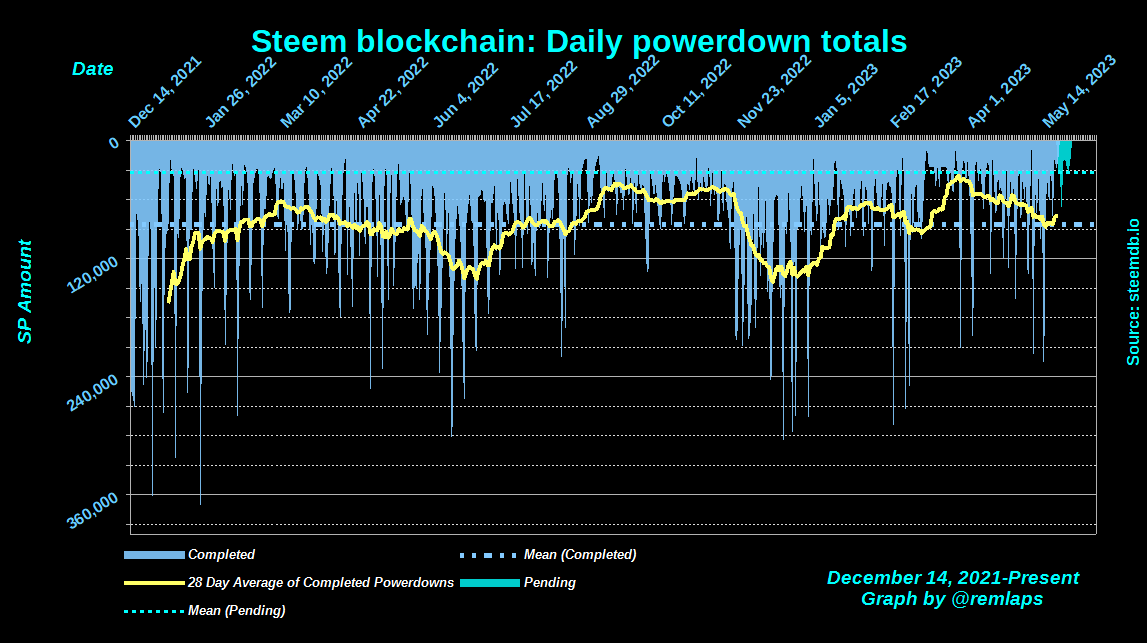
The horizontal lines are the average values for completed (blue) and pending (cyan) powerdowns, and the yellow line is a 28 day moving average of completed powerdowns. "Pending" numbers now come from the Steemit API, not from steemdb.io.
Here are some descriptive statistics for the numbers geeks
| And with a total of 777 pending power downs (down from 835 last week), here are the times, dates, and amounts of the top-10 |
|---|
1 2023-05-21T22:40:12 - 42,082,154 VESTS, 23,841 STEEM
2 2023-05-22T05:01:36 - 25,607,140 VESTS, 14,507 STEEM
3 2023-05-23T10:36:54 - 22,108,652 VESTS, 12,525 STEEM
4 2023-05-23T15:35:42 - 20,819,041 VESTS, 11,795 STEEM
5 2023-05-26T06:21:30 - 15,403,383 VESTS, 8,726 STEEM
6 2023-05-21T22:40:39 - 13,487,837 VESTS, 7,641 STEEM
7 2023-05-23T15:56:00 - 12,966,691 VESTS, 7,346 STEEM
8 2023-05-23T17:27:42 - 12,222,068 VESTS, 6,924 STEEM
9 2023-05-28T09:03:03 - 11,138,261 VESTS, 6,310 STEEM
10 2023-05-27T01:10:30 - 10,298,130 VESTS, 5,834 STEEM
Notes
- Reference prices for STEEM and other tokens are downloaded from coingecko.com
Previous posts
- Steem Total Value Powered Up - $34 million - May 21, 2023
- Steem Total Value Powered Up - $34 million - May 14, 2023
- Steem Total Value Powered Up - $37 million - May 7, 2023
- Steem Total Value Powered Up - $38 million - April 30, 2023
- Steem Total Value Powered Up - $38 million - April 23, 2023
- Steem Total Value Powered Up - $41 million - April 16, 2023
- Steem Total Value Powered Up - $38 million - April 9, 2023
- Steem Total Value Powered Up - $36 million - April 2, 2023
- Steem Total Value Powered Up - $37 million - March 26, 2023
- Steem Total Value Powered Up - $38 million - March 19, 2023
- Steem Total Value Powered Up - $31 million - March 12, 2023
- Steem Total Value Powered Up - $37 million - March 5, 2023
- Steem Total Value Powered Up - $41 million - February 26, 2023
- Steem Total Value Powered Up - $40 million - February 19, 2023
- Steem Total Value Powered Up - $38 million - February 12, 2023
- Steem Total Value Powered Up - $36 million - February 5, 2023
- Steem Total Value Powered Up - $35 million - January 29, 2023
- Steem Total Value Powered Up - $33 million - January 22, 2023
- Steem Total Value Powered Up - $30 million - January 15, 2023
- Steem Total Value Powered Up - $25 million - January 8, 2023
- Steem Total Value Powered Up - $24 million - January 1, 2023
For links from 2021 and 2022, see these posts:
- Steem Total Value Powered Up - $67 million - January 2,
20212022 - Steem Total Value Powered Up - $36 million - June 26, 2022
- Steem Total Value Powered Up - $26 million - December 18, 2022

Pixabay license, source
Reminder
Visit the /promoted page and #burnsteem25 to support the inflation-fighters who are helping to enable decentralized regulation of Steem token supply growth.
Thanks for the analysis. SP buff decreased due to price. The greater the empowerment, the higher the strength of the ecosystem.
I keep looking at the price of SBD and I feel annoyed, the price of STEEM in relation to that of SBD is quite different, I sell steem to obtain sbd and it shouldn't be like that, I better not say anything else.
Excuse my comment, but I don't like injustices
In total, steem is growing and that's a fact. Too bad the price has gone down a bit. I honestly didn't really expect this. According to my calculations, the price should have risen a little. And she went down.
This post has been featured in the latest edition of Steem News...