Steem Total Value Powered Up - $33 million - June 4, 2023
This is next in my series of posts reviewing the amount and value of powered up STEEM on the Steem blockchain. For previous posts, see the end of this entry.
Noteworthy in the last week |
|---|
- Week over week, the number of powered up STEEM increased by about 540 thousand SP, or 0.31%.
- Over the course of the week, we saw seven daily increases and seven new highs in the number of staked STEEM. This brings the streaks to 21 consecutive daily increases and 17 straight new highs.
- The modeled value of powered-up (staked) STEEM lost ground against all comparison values.
- Changes ranged from 0% against USD to -6 3/4% against LTC.
- Compared to the January 1, 2023 baseline, the modeled value has lost ground against all comparison tokens except for SBD, and USD.
- This week's completed powerdowns were reported at 233K, which is a decrease of almost 10% from last week's 258K.
- We saw 2,787 new accounts created - down from 2,943 last week.
- Net migrations of account classifications showed five less dolphins, 3 more minnows, and 2 additional redfish.
Here are the numbers as-of a few minutes ago |
|---|
Total value locked in powered-up STEEM (USD): $32,738,392.82
External STEEM market cap (coingecko) $81,620,887.52
Internal STEEM market cap (median_price * current_supply) $79,289,200.00
Locked value in terms of other tokens:
| token | price | locked value equivalent | Jan 1, 2023 | pct of Jan 1 baseline |
|---|---|---|---|---|
| tron | $0.08 | 400,259,103 | 445,758,870 | 89.79% |
| steem-dollars | $2.28 | 14,358,944 | 11,564,498 | 124.16% |
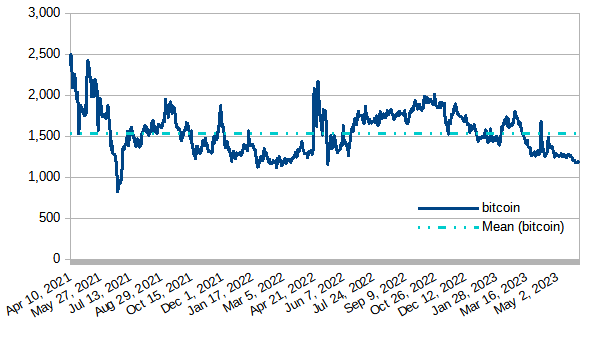
| bitcoin | $27,242.00 | 1,201 | 1,477 | 81.35% |
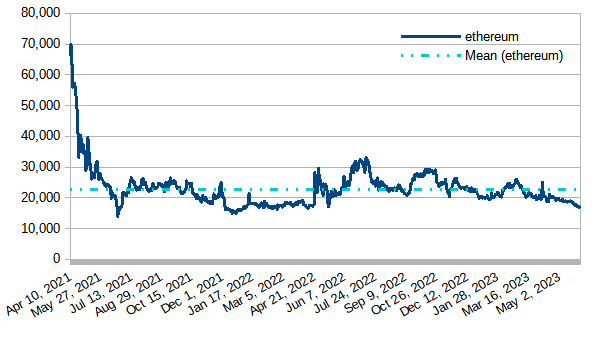
| ethereum | $1,905.60 | 17,180 | 20,406 | 84.19% |
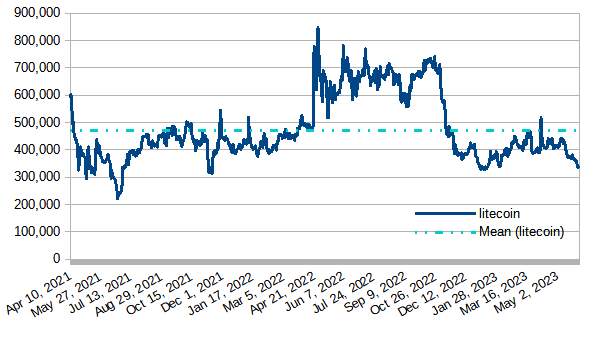
| litecoin | $95.85 | 341,558 | 344,287 | 99.21% |
| steem | $0.19 | 174,714,716 | 166,882,703 | 104.69% |
| USD | $1.00 | 32,738,393 | 24,516,738 | 133.54% |
|
|---|
This slide (new after April 16) takes its data from steemchiller's SDS getVestingStats API call.
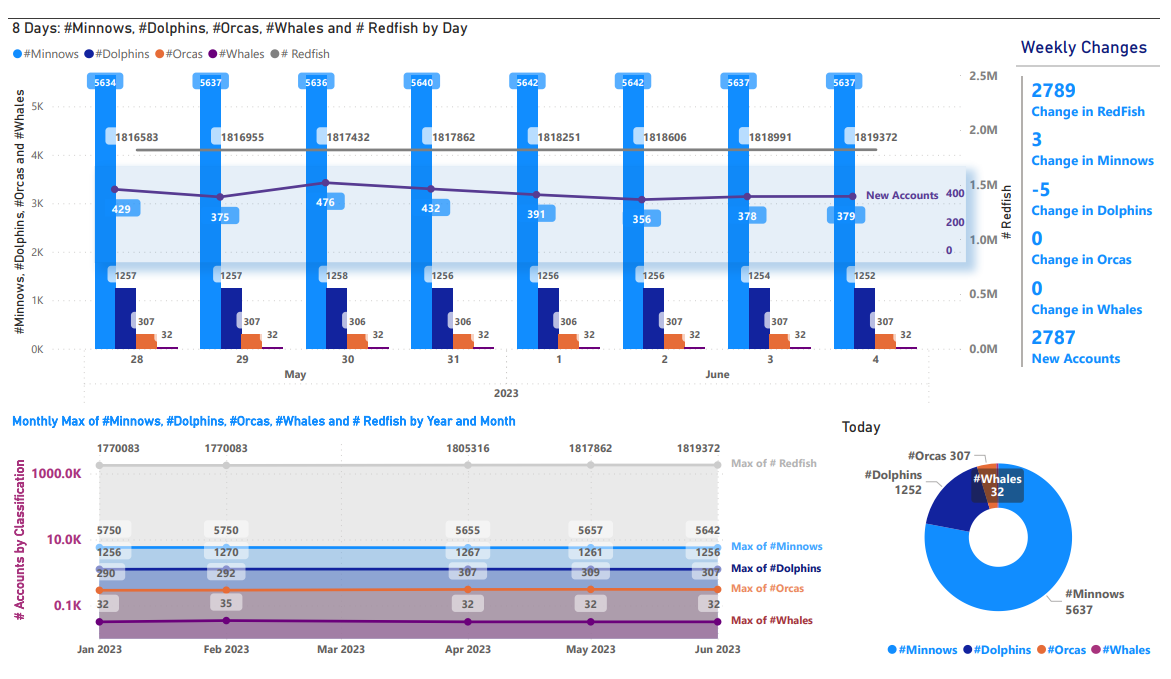
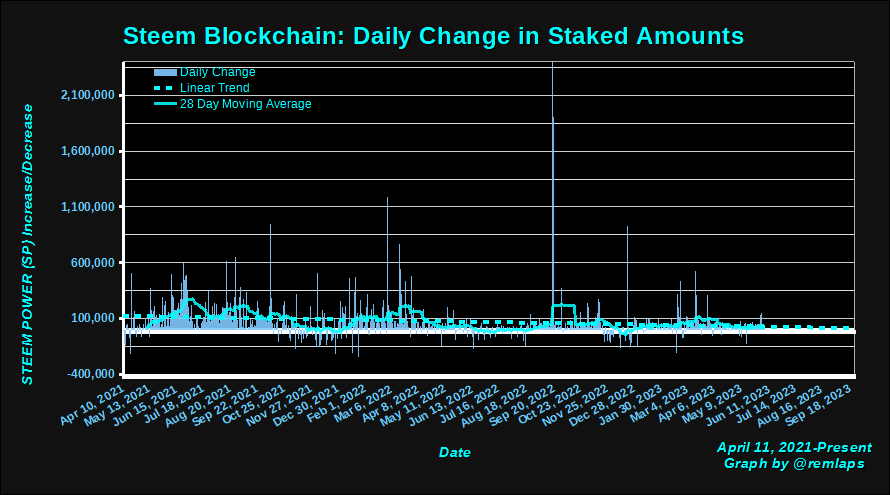
Daily Changes
Here is a chart of daily changes in powered-up STEEM from April 11, 2021 to present. The graph also includes a linear trend line and a 28 day moving average.
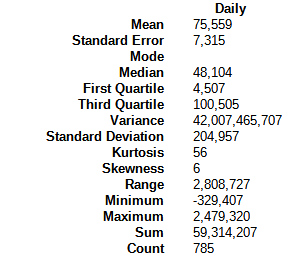
Here are some descriptive statistics, for numbers geeks.
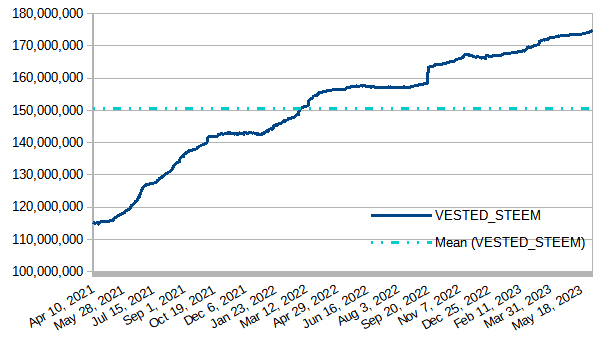
VESTED STEEM
Today's downloaded value was 174,709,432, which is up by about 540K STEEM, or about 3/10% from last week's observed value. The graph continues to show a slight upslope.
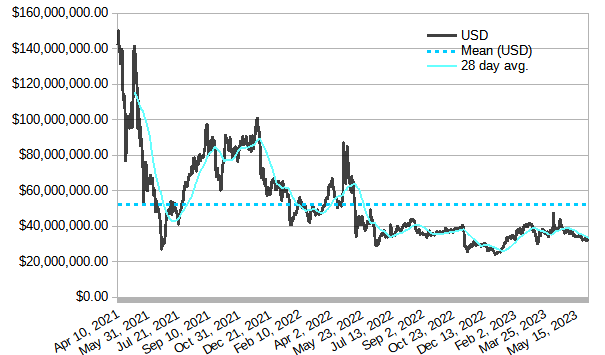
Modeled value of powered-up STEEM in terms of USD
In terms of USD, today's value at download time - a bit under $33 million for the 2nd week in a row - remains higher than the December 30, 2022 low of $23,718,335.58. It lost about $9,000 or 0% from last week's value.
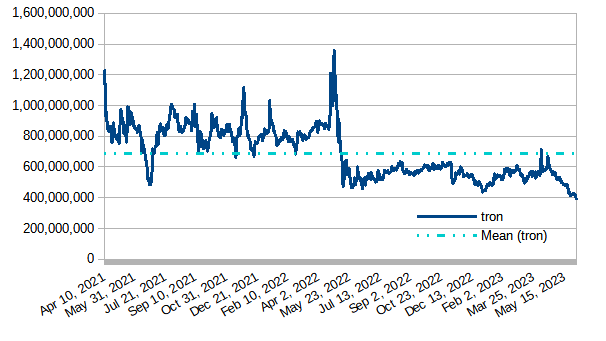
Modeled value of powered-up STEEM in terms of Tron (TRX)
Powered-up STEEM moved lower against TRX by about 25 million tokens or a bit over 5 3/4%. After @justinsunsteemit made the announcement that Tron went live on the Ethereum blockchain, the token jumped by 10% in a day. As a result, we see a new all-time low of modeled SP vs. TRX value yesterday (June 3) at 392,076,391. It has now bounced back to 399,741,860. The previous low was logged on May 25.
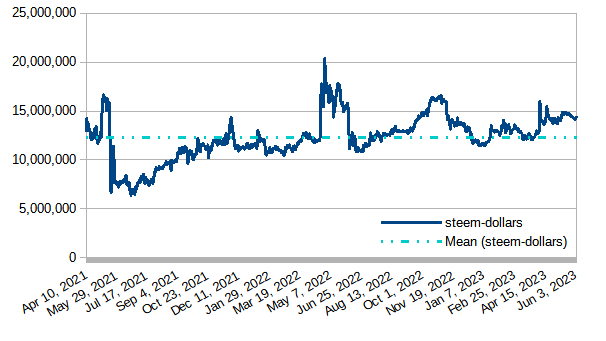
Modeled value of powered-up STEEM in terms of Steem Dollars
Powered-up STEEM declined by about 67K SBDs, almost 1/2%, during the last week.
Modeled value of powered-up STEEM as a percentage of Steem's market cap
With today's observed value crossed of 40.10% the graph continues to hover near the 40% line again this week, but the last 5 days have all been above that threshold. We have now seen 5 days above 40%; 426 consecutive days above 39%; 490 consecutive days above 37%; 617 consecutive days above 35%; and 680 straight days above 1/3.
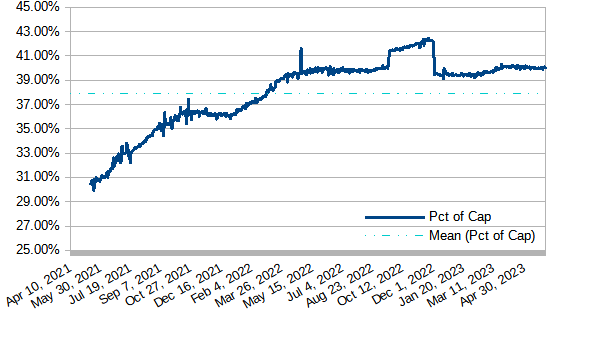
*As previously reported, the big drop on December 4, 2022 was due to a correction in the value that Coingecko is getting for its circulating supply. Numbers before December 4, 2022 were based on an artificially low supply measurement.
Modeled value of powered-up STEEM in terms of bitcoin (BTC)
Powered-up STEEM declined by about 1 BTC, or roughly 1/10%.
Modeled value of powered-up STEEM in terms of Ethereum
Powered-up STEEM declined in the last seven days by 600 ETH, or a little over 3 1/3%.
Modeled value of powered-up STEEM in terms of LTC
In the last 7 days, powered-up STEEM moved down against LTC by about 25K LTC, which is about 6 3/4%.
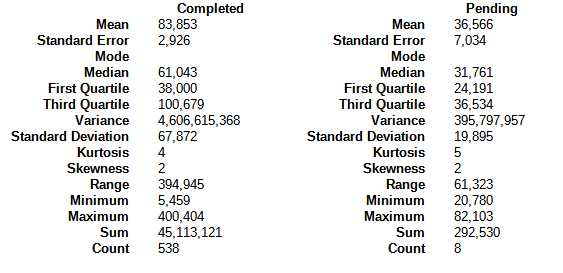
Daily Powerdown Activity
Here is graph with data from steemdb.io to show daily completed and pending powerdown activity. The graph shows 233K in completed powerdowns last week and 287K pending (both measured from Sunday through Saturday[GMT time zone]). This represents a potential increase in powerdowns by about 23% or less. The 28-day moving average line is near (but slightly above) an all-time low.
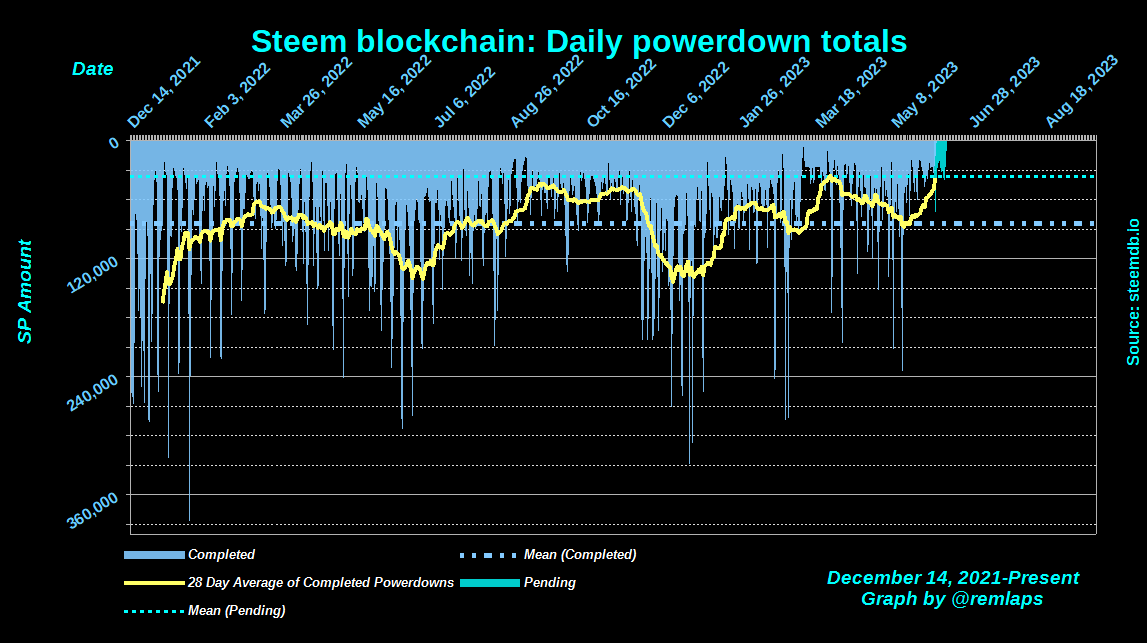
The horizontal lines are the average values for completed (blue) and pending (cyan) powerdowns, and the yellow line is a 28 day moving average of completed powerdowns. "Pending" numbers now come from the Steemit API, not from steemdb.io.
Here are some descriptive statistics for the numbers geeks
| And with a total of 946 pending power downs (up from 821 last week), here are the times, dates, and amounts of the top-10 |
|---|
1 2023-06-04T22:40:24 - 132,468,434 VESTS, 75,128 STEEM
2 2023-06-05T05:01:36 - 25,607,140 VESTS, 14,523 STEEM
3 2023-06-10T02:36:12 - 22,043,053 VESTS, 12,501 STEEM
4 2023-06-09T02:13:54 - 16,837,768 VESTS, 9,549 STEEM
5 2023-06-08T05:28:48 - 16,808,049 VESTS, 9,532 STEEM
6 2023-06-08T17:19:54 - 12,635,759 VESTS, 7,166 STEEM
7 2023-06-11T09:03:03 - 11,138,261 VESTS, 6,317 STEEM
8 2023-06-10T11:26:36 - 9,272,788 VESTS, 5,259 STEEM
9 2023-06-11T13:18:12 - 8,816,243 VESTS, 5,000 STEEM
10 2023-06-10T17:21:00 - 7,921,492 VESTS, 4,493 STEEM
Notes
- Reference prices for STEEM and other tokens are downloaded from coingecko.com
Previous posts
- Steem Total Value Powered Up - $33 million - June 4, 2023
- Steem Total Value Powered Up - $33 million - May 28, 2023
- Steem Total Value Powered Up - $34 million - May 21, 2023
- Steem Total Value Powered Up - $34 million - May 14, 2023
- Steem Total Value Powered Up - $37 million - May 7, 2023
- Steem Total Value Powered Up - $38 million - April 30, 2023
- Steem Total Value Powered Up - $38 million - April 23, 2023
- Steem Total Value Powered Up - $41 million - April 16, 2023
- Steem Total Value Powered Up - $38 million - April 9, 2023
- Steem Total Value Powered Up - $36 million - April 2, 2023
- Steem Total Value Powered Up - $37 million - March 26, 2023
- Steem Total Value Powered Up - $38 million - March 19, 2023
- Steem Total Value Powered Up - $31 million - March 12, 2023
- Steem Total Value Powered Up - $37 million - March 5, 2023
- Steem Total Value Powered Up - $41 million - February 26, 2023
- Steem Total Value Powered Up - $40 million - February 19, 2023
- Steem Total Value Powered Up - $38 million - February 12, 2023
- Steem Total Value Powered Up - $36 million - February 5, 2023
- Steem Total Value Powered Up - $35 million - January 29, 2023
- Steem Total Value Powered Up - $33 million - January 22, 2023
- Steem Total Value Powered Up - $30 million - January 15, 2023
- Steem Total Value Powered Up - $25 million - January 8, 2023
- Steem Total Value Powered Up - $24 million - January 1, 2023
For links from 2021 and 2022, see these posts:
- Steem Total Value Powered Up - $67 million - January 2,
20212022 - Steem Total Value Powered Up - $36 million - June 26, 2022
- Steem Total Value Powered Up - $26 million - December 18, 2022

Pixabay license, source
Reminder
Visit the /promoted page and #burnsteem25 to support the inflation-fighters who are helping to enable decentralized regulation of Steem token supply growth.
I was able to calculate the average of the first half of 2022 of Steem Total Value Powered Up and it was $51.5 million (approx) compared to the first half of this year, which is $35.08 million and there is a decline of $ 16.42 million (Approx), we hope that in the next 6 months we will recover that difference. Thanks for the data.
In steem they invest once its total cost only increases compared to the previous weeks. they invest once its total cost only increases compared to the previous weeks. 17 new highs in a row is cool! I am glad to be a part of this platform!
Thanks for the analysis. 540K! Uwww is the highest figure in recent weeks. If we can reach the 1 million power up target per week, things will go better.
We are in the middle of the year, I hope that by the end of the year we will be able to see a more significant increase