Steem Total Value Powered Up - $38 million - April 30, 2023
This is next in my series of posts reviewing the amount and value of powered up STEEM on the Steem blockchain. For previous posts, see the end of this entry.
Noteworthy in the last week |
|---|
- Week over week, the number of powered up STEEM increased by about 129 thousand SP, or 0.07%.
- Over the course of the week, we saw four daily increases and four new highs in the number of staked STEEM.
- The modeled value of powered-up (staked) STEEM lost ground against all comparison values.
- Changes ranged from -8% against BTC to -1 3/4% against SBD.
- Compared to the January 1, 2023 baseline, the modeled value is higher than all comparison tokens, except for BTC and ETH.
- This week's completed powerdowns were reported at 533K, which is an increase of about 19% from last week's 447K.
- We saw net migrations of two dolphin accounts, one to the minnow category, and the other to the orca category.
Here are the numbers as-of a few minutes ago |
|---|
Total value locked in powered-up STEEM (USD): $37,536,932.67
External STEEM market cap (coingecko) $93,804,972.99
Internal STEEM market cap (median_price * current_supply) $91,771,500.00
Locked value in terms of other tokens:
| token | price | locked value equivalent | Jan 1, 2023 | pct of Jan 1 baseline |
|---|---|---|---|---|
| tron | $0.07 | 554,189,725 | 445,758,870 | 124.32% |
| steem-dollars | $2.67 | 14,058,776 | 11,564,498 | 121.57% |
| bitcoin | $29,601.00 | 1,268 | 1,477 | 85.88% |
| ethereum | $1,919.60 | 19,554 | 20,406 | 95.83% |
| litecoin | $90.05 | 416,845 | 344,287 | 121.07% |
| steem | $0.22 | 173,391,163 | 166,882,703 | 103.90% |
| USD | $1.00 | 37,536,933 | 24,516,738 | 153.11% |
|
|---|
This slide (new after April 16) takes its data from steemchiller's SDS getVestingStats API call.
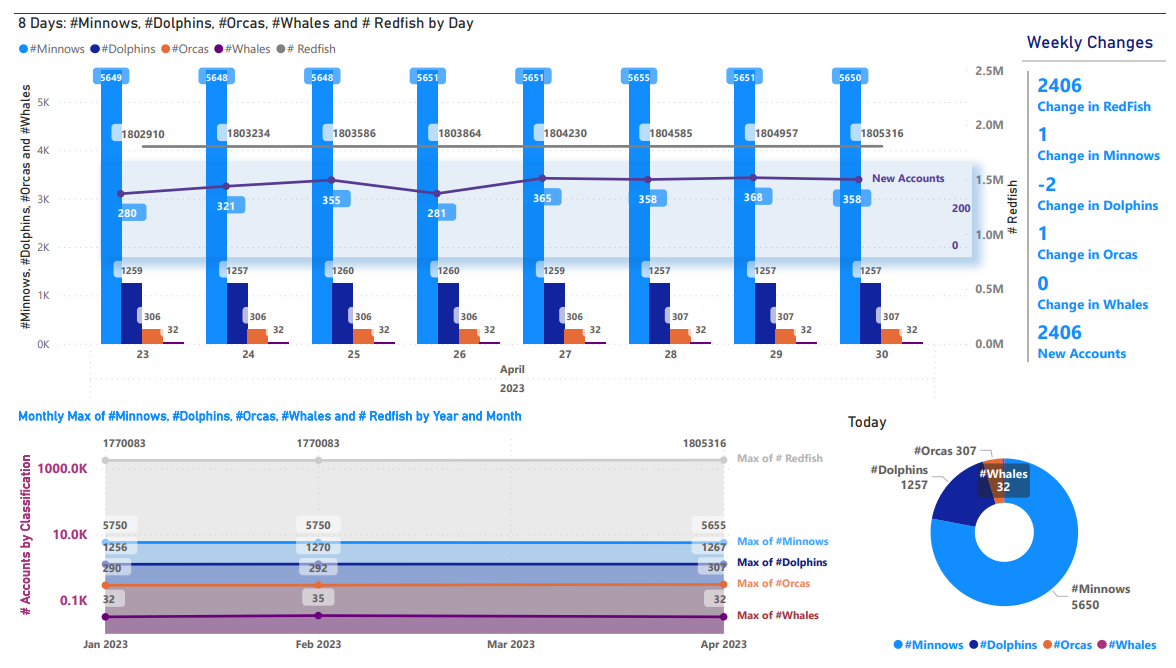
Daily Changes
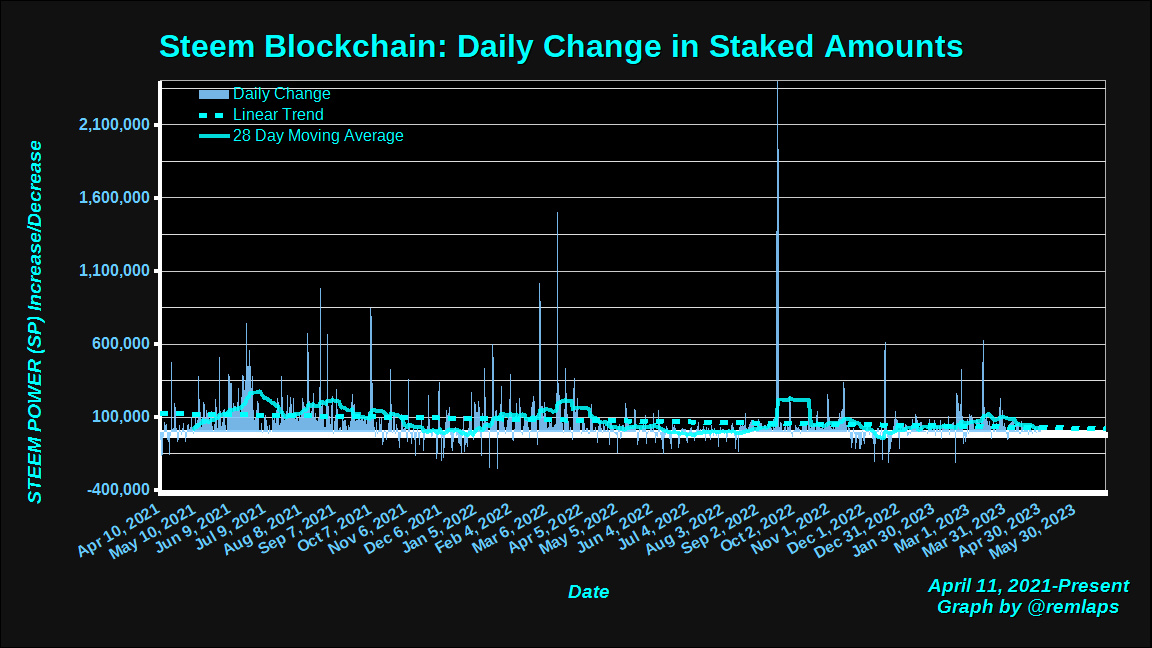
Here is a chart of daily changes in powered-up STEEM from April 11, 2021 to present. The graph also includes a linear trend line and a 28 day moving average. The 28-day average has continued drifting back towards the zero line.
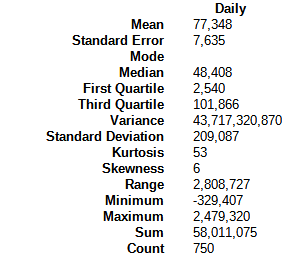
Here are some descriptive statistics, for numbers geeks.
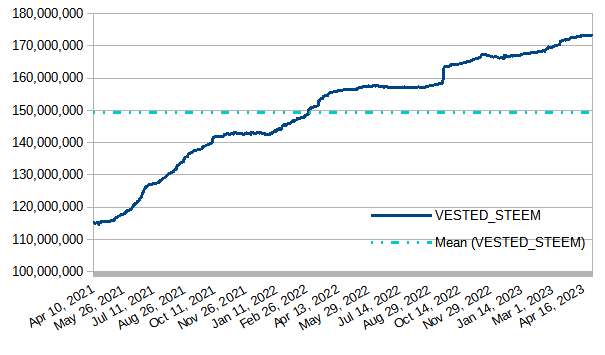
VESTED STEEM
Today's downloaded value was 173,406,300, which is up by about 129K STEEM, or about 1/10% from last week's observed value. The graph has turned almost flat, with a barely perceptible upslope.
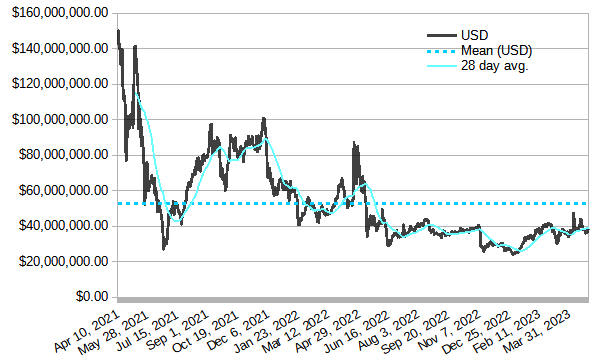
Modeled value of powered-up STEEM in terms of USD
In terms of USD, today's value at download time - a bit over $37 million - remains higher than the December 30, 2022 low of $23,718,335.58. It declined by about $1 million - or 2 1/2% from last week's value.
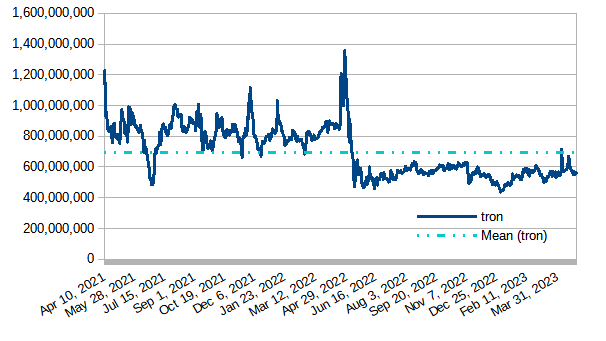
Modeled value of powered-up STEEM in terms of Tron (TRX)
Powered-up STEEM lost against TRX by about 23 million tokens or roughly 4%.
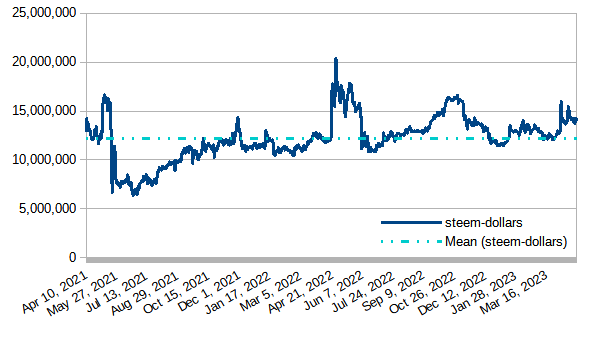
Modeled value of powered-up STEEM in terms of Steem Dollars
Powered-up STEEM lost ground by about 28K SBDs over the last week, which is about 1 3/4%.
Modeled value of powered-up STEEM as a percentage of Steem's market cap
After today's observed value of 39.94% the graph continued to straddle the 40% line for the third consecutive week. We have now seen 391 consecutive days above 39%; 455 consecutive days above 37%; 582 consecutive days above 35%; and 645 straight days above 1/3. Today was the first day below 40% since last Sunday (April 23).
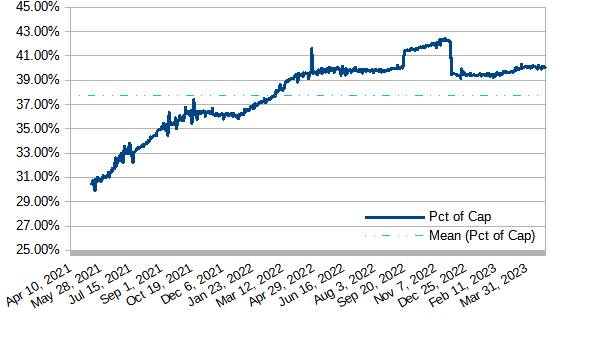
*As previously reported, the big drop on December 4, 2022 was due to a correction in the value that Coingecko is getting for its circulating supply. Numbers before December 4, 2022 were based on an artificially low supply measurement.
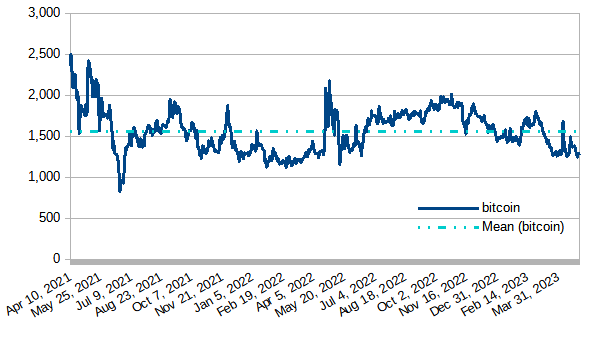
Modeled value of powered-up STEEM in terms of bitcoin (BTC)
Powered-up STEEM was down by about 111 BTC, or just over 8%.
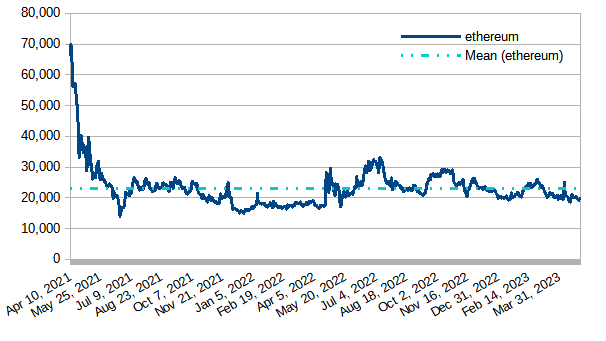
Modeled value of powered-up STEEM in terms of Ethereum
Powered-up STEEM declined in the last seven days by 838 ETH, or about 4%.
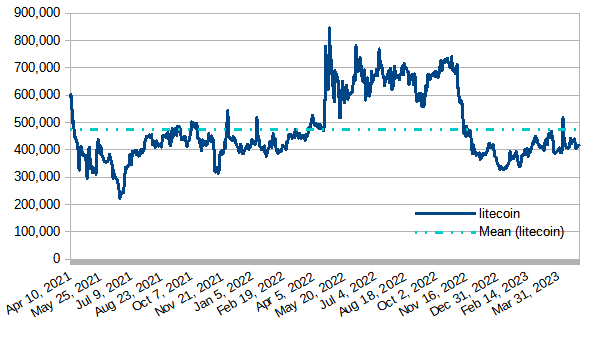
Modeled value of powered-up STEEM in terms of LTC
In the last 7 days, powered-up STEEM lost ground against LTC by about 28K LTC, which is about 6 1/3%.
Daily Powerdown Activity
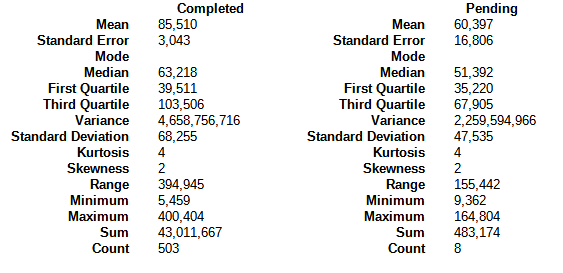
Here is graph with data from steemdb.io to show daily completed and pending powerdown activity. The graph shows 533K in completed powerdowns last week and 486K pending (both measured from Sunday through Saturday[GMT time zone]). This represents a potential decrease in powerdowns by about 9% or more.
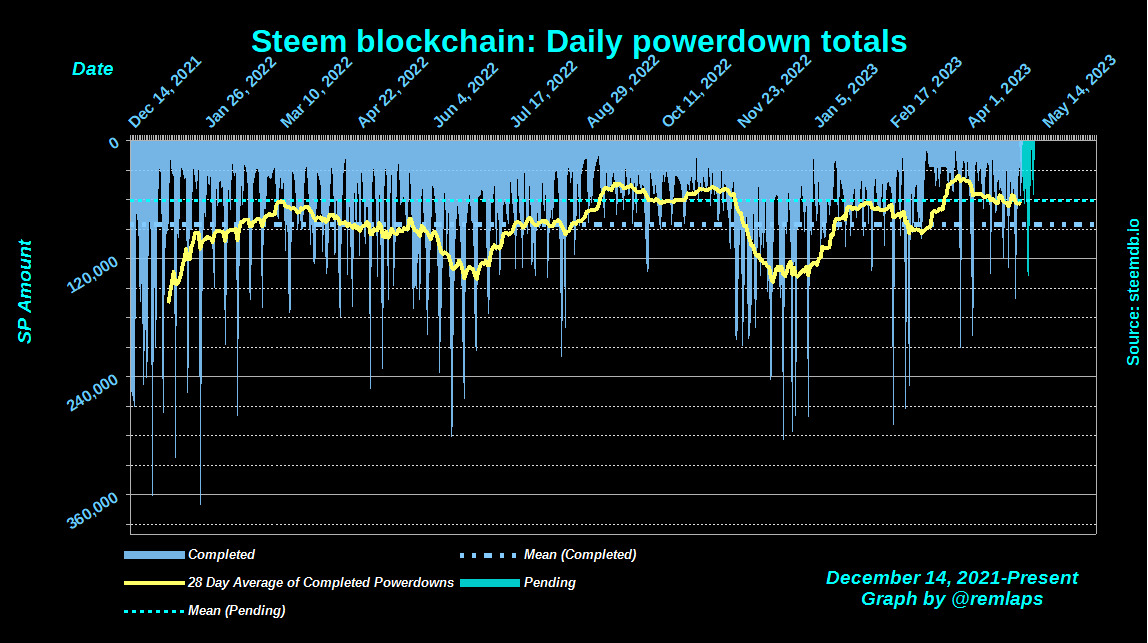
The horizontal lines are the average values for completed (blue) and pending (cyan) powerdowns, and the yellow line is a 28 day moving average of completed powerdowns. "Pending" numbers now come from the Steemit API, not from steemdb.io.
Here are some descriptive statistics for the numbers geeks
| And with a total of 1,022 pending power downs (down from 1,041 last week), here are the times, dates, and amounts of the top-10 |
|---|
1 2023-05-05T07:29:54 - 89,575,007 VESTS, 50,665 STEEM
2 2023-05-04T21:27:09 - 59,348,326 VESTS, 33,568 STEEM
3 2023-05-04T21:27:57 - 41,651,353 VESTS, 23,559 STEEM
4 2023-05-04T17:14:30 - 41,052,388 VESTS, 23,220 STEEM
5 2023-05-07T15:06:30 - 40,603,051 VESTS, 22,966 STEEM
6 2023-04-30T23:25:54 - 28,317,586 VESTS, 16,017 STEEM
7 2023-05-03T07:44:27 - 25,096,635 VESTS, 14,195 STEEM
8 2023-05-02T04:15:00 - 22,296,760 VESTS, 12,611 STEEM
9 2023-05-04T19:47:39 - 22,128,501 VESTS, 12,516 STEEM
10 2023-05-02T10:36:54 - 22,108,652 VESTS, 12,505 STEEM
Notes
- Reference prices for STEEM and other tokens are downloaded from coingecko.com
Previous posts
- Steem Total Value Powered Up - $38 million - April 30, 2023
- Steem Total Value Powered Up - $38 million - April 23, 2023
- Steem Total Value Powered Up - $41 million - April 16, 2023
- Steem Total Value Powered Up - $38 million - April 9, 2023
- Steem Total Value Powered Up - $36 million - April 2, 2023
- Steem Total Value Powered Up - $37 million - March 26, 2023
- Steem Total Value Powered Up - $38 million - March 19, 2023
- Steem Total Value Powered Up - $31 million - March 12, 2023
- Steem Total Value Powered Up - $37 million - March 5, 2023
- Steem Total Value Powered Up - $41 million - February 26, 2023
- Steem Total Value Powered Up - $40 million - February 19, 2023
- Steem Total Value Powered Up - $38 million - February 12, 2023
- Steem Total Value Powered Up - $36 million - February 5, 2023
- Steem Total Value Powered Up - $35 million - January 29, 2023
- Steem Total Value Powered Up - $33 million - January 22, 2023
- Steem Total Value Powered Up - $30 million - January 15, 2023
- Steem Total Value Powered Up - $25 million - January 8, 2023
- Steem Total Value Powered Up - $24 million - January 1, 2023
For links from 2021 and 2022, see these posts:
- Steem Total Value Powered Up - $67 million - January 2,
20212022 - Steem Total Value Powered Up - $36 million - June 26, 2022
- Steem Total Value Powered Up - $26 million - December 18, 2022

Pixabay license, source
Reminder
Visit the /promoted page and #burnsteem25 to support the inflation-fighters who are helping to enable decentralized regulation of Steem token supply growth.
Thanks for the analysis. Steem gives us a little idea about its price. This week's steem power boost is good.
I perform POWER UP constantly, without a doubt it is something that motivates us to continue working, not everyone does it, but possibly they have their reasons and it is respectable in my opinion.
I wish you a happy start to the week