Steem Total Value Powered Up - $35 million - January 29, 2023
This is next in my series of posts reviewing the amount and value of powered up STEEM on the Steem blockchain. For previous posts, see the end of this entry.
Before we get to the numbers, though, let me just insert a YouTube video (@cmp2020, @astronomyizfun, and I saw this performed live at a Beethoven symphony in 2018.) ;-):
Now, on to the numbers
Noteworthy in the last week |
|---|
- Week over week, the number of powered up STEEM increased by about 181K SP, or 0.11%.
- Over the course of the week, we saw six daily increases and six new highs in the number of staked STEEM.
- The modeled value lost ground against all comparison tokens, except for USD and ETH. Changes ranged from -4.84% against LTC to +4.31% against ETH.
- Compared to the January 1, 2023 baseline, the modeled value is higher than all comparison tokens except for BTC.
- This week (Sunday through Saturday) saw a total of 498K STEEM powered down, which is up by about 27% from last week's 391K STEEM (Sunday through Saturday).
Here are the numbers as-of a few minutes ago |
|---|
Total value locked in powered-up STEEM (USD): $34,561,967.07
Exernal STEEM market cap (coingecko) $87,653,667.59
Internal STEEM market cap (median_price * current_supply) $86,412,000.00
Locked value in terms of other tokens:
| token | price | locked value equivalent | Jan 1, 2023 | pct of Jan 1 baseline |
|---|---|---|---|---|
| tron | $0.06 | 540,250,212 | 445,758,870 | 121.20% |
| steem-dollars | $2.67 | 12,944,556 | 11,564,498 | 111.93% |
| bitcoin | $23,800.00 | 1,452 | 1,477 | 98.34% |
| ethereum | $1,644.86 | 21,012 | 20,406 | 102.97% |
| litecoin | $96.89 | 356,713 | 344,287 | 103.61% |
| steem | $0.21 | 167,856,393 | 166,882,703 | 100.58% |
| USD | $1.00 | 34,561,967 | 24,516,738 | 140.97% |
|
|---|
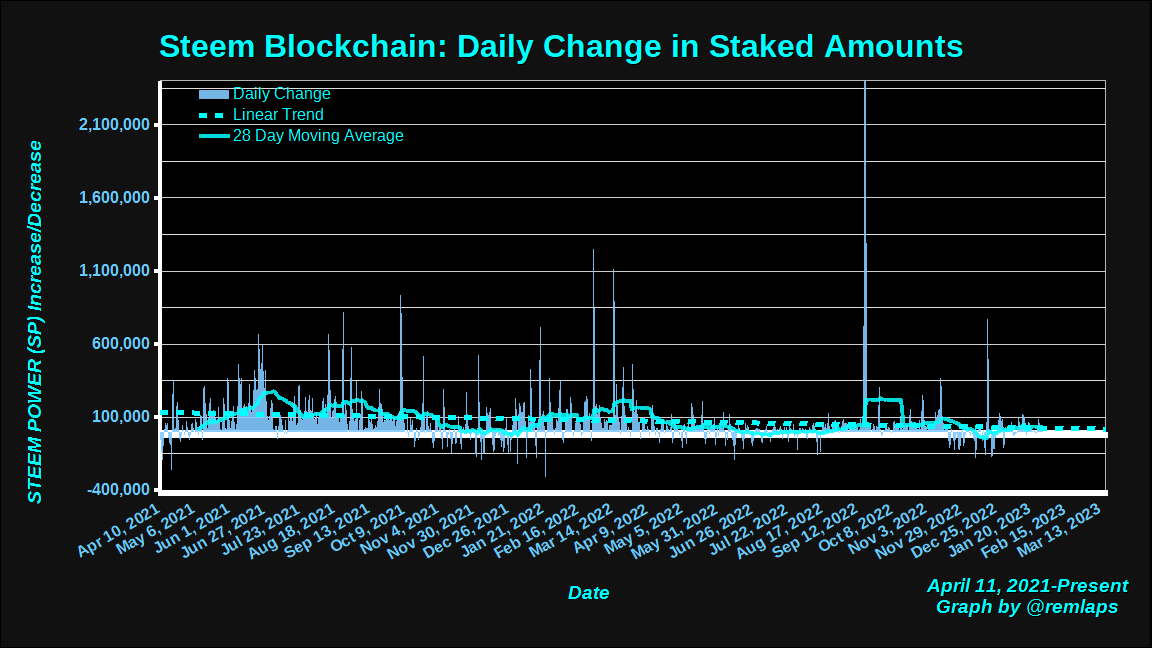
Daily Changes
Here is a chart of daily changes in powered-up STEEM from April 11, 2021 to present. The graph also includes a linear trend line and a 28 day moving average.
Here are some descriptive statistics, for numbers geeks.
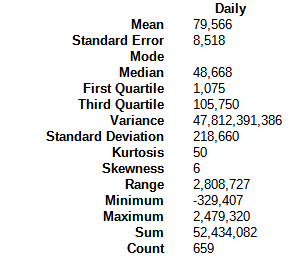
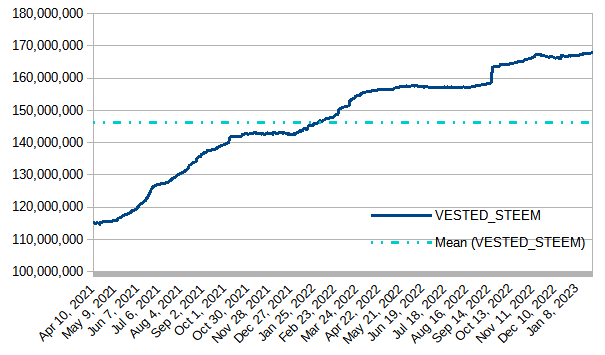
VESTED STEEM
Today's observed value was 167,829,307, which is up by about 181K STEEM, or 1/10% from last week's observed value. The graph remains basically flat, with a slightly perceptible upslope, during recent weeks.
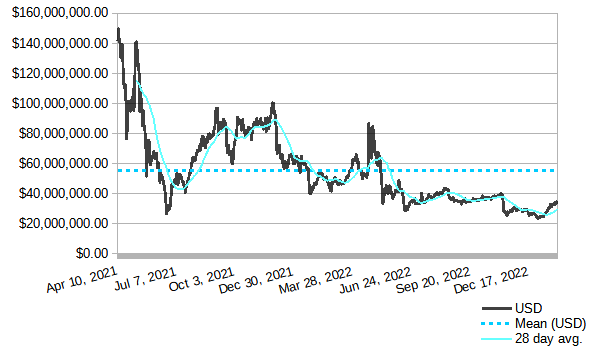
Modeled value of powered-up STEEM in terms of USD
In terms of USD, the value remained above the December 30, 2022 low of $23,718,335.58 and advanced by another $866K -- more than 2 1/2% -- over last week's value.
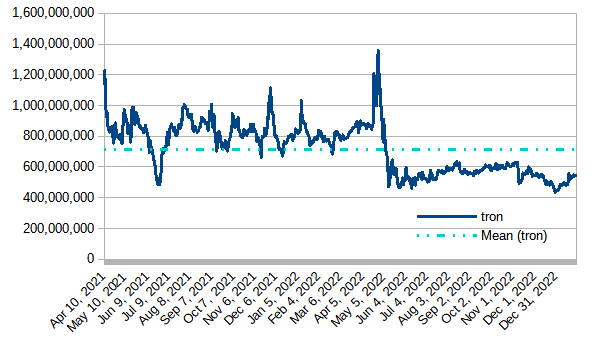
Modeled value of powered-up STEEM in terms of Tron (TRX)
Powered-up STEEM advanced against TRX by about 4.8 million tokens or less than 1%.
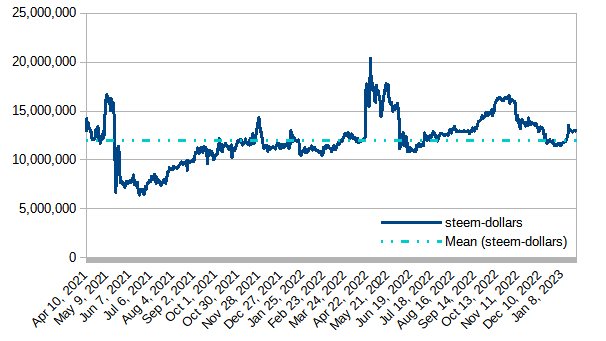
Modeled value of powered-up STEEM in terms of Steem Dollars
Powered-up STEEM declined about 113K SBDs over the last week, which is a bit under 1%
Modeled value of powered-up STEEM as a percentage of Steem's market cap
After today's observed value of 39.38% the graph was basically flat for the past eight weeks. We have now seen 300 consecutive days above 39%; 364 consecutive days above 37%; 491 consecutive days above 35%; and 554 straight days above 1/3. Will it hold above 39? Will it climb to 40%?
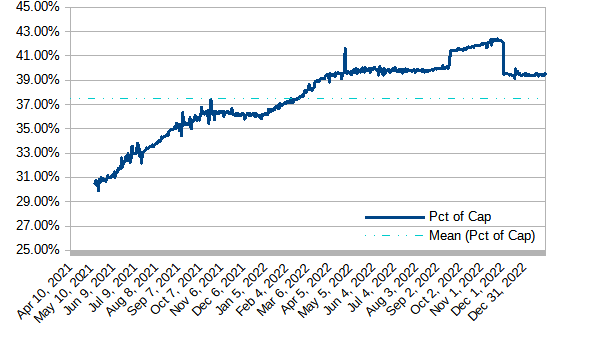
*As previously reported, the big drop on December 4, 2022 was due to a correction in the value that Coingecko is getting for its circulating supply. Numbers before December 4, 2022 were based on an artificially low supply measurement.
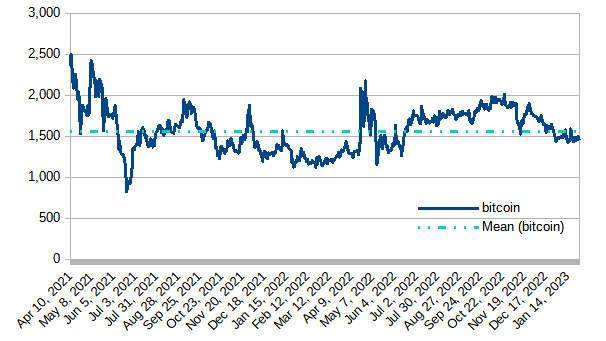
Modeled value of powered-up STEEM in terms of bitcoin (BTC)
Powered-up STEEM lost ground by about 12 BTC, or less than 1% during the week.
Modeled value of powered-up STEEM in terms of Ethereum
Powered-up STEEM gained ground in the last seven days by ~872 ETH, or more than 4%.
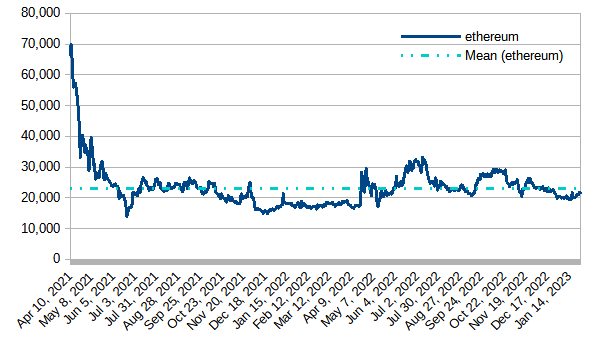
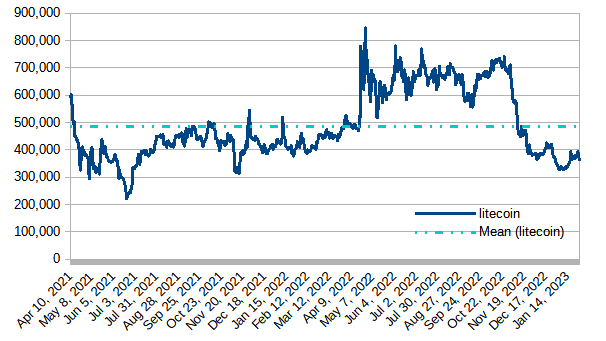
Modeled value of powered-up STEEM in terms of LTC
In the last 7 days, powered-up STEEM lost ground against LTC by about 18K LTC, or roughly 5%.
Daily Powerdown Activity
Here is graph with data from steemdb.io to show daily completed and pending powerdown activity. With 498K in completed powerdowns last week and 495K pending (both measured from Sunday through Saturday[GMT time zone]), we might expect powerdowns to decrease next week by 1/2% or more.
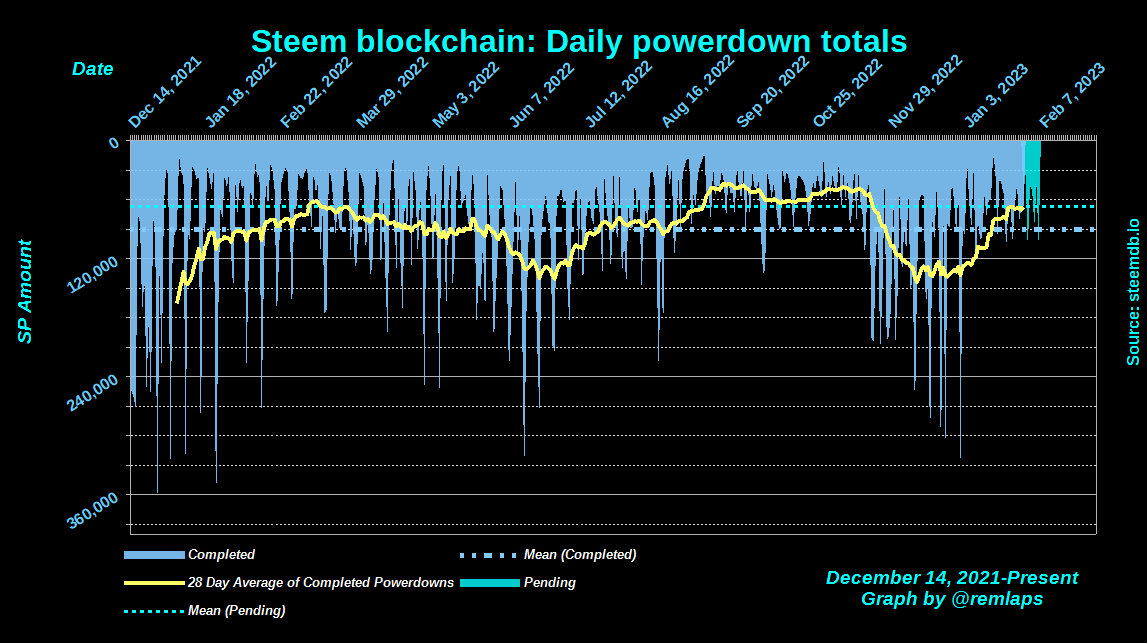
The horizontal lines are the average values for completed (blue) and pending (cyan) powerdowns, and the yellow line is a 28 day moving average of completed powerdowns. "Pending" numbers now come from the Steemit API, not from steemdb.io.
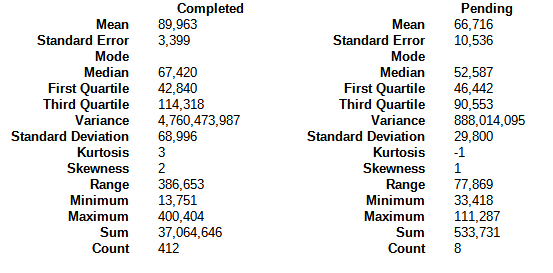
Here are some descriptive statistics for the numbers geeks
| And with a total of 1,068 pending power downs (up from 1,040 last week), here are the times, dates, and amounts of the top-10 |
|---|
1 2023-02-05T15:05:06 - 150,832,479 VESTS, 84,710 STEEM
2 2023-01-31T03:02:30 - 129,601,623 VESTS, 72,787 STEEM
3 2023-02-05T18:05:09 - 91,485,717 VESTS, 51,380 STEEM
4 2023-02-03T17:35:51 - 85,992,982 VESTS, 48,295 STEEM
5 2023-02-02T10:11:48 - 24,948,755 VESTS, 14,012 STEEM
6 2023-02-01T22:08:33 - 24,385,467 VESTS, 13,695 STEEM
7 2023-02-02T18:55:57 - 21,024,440 VESTS, 11,808 STEEM
8 2023-01-30T13:56:45 - 12,789,135 VESTS, 7,183 STEEM
9 2023-02-04T17:10:57 - 11,891,561 VESTS, 6,679 STEEM
10 2023-02-04T18:16:45 - 11,297,767 VESTS, 6,345 STEEM
Notes
- Reference prices for STEEM and other tokens are downloaded from coingecko.com
Previous posts
- Steem Total Value Powered Up - $35 million - January 29, 2023
- Steem Total Value Powered Up - $33 million - January 22, 2023
- Steem Total Value Powered Up - $30 million - January 15, 2023
- Steem Total Value Powered Up - $25 million - January 8, 2023
- Steem Total Value Powered Up - $24 million - January 1, 2023
For links from 2021 and 2022, see these posts:
- Steem Total Value Powered Up - $67 million - January 2,
20212022 - Steem Total Value Powered Up - $36 million - June 26, 2022
- Steem Total Value Powered Up - $26 million - December 18, 2022

Pixabay license, source
Reminder
Visit the /promoted page and #burnsteem25 to support the inflation-fighters who are helping to enable decentralized regulation of Steem token supply growth.166,084,856
The increase is an incentive to continue
In the period when prices are rising, there is not much reinforcement. I think 181K a week is not bad.
This post has been featured in the latest edition of Steem News...