Finally decoded the puzzle.
This DXY chart goes back to 1967
.png)
I was playing around to see if I could figure things out. I mapped out the DXY. It goes back to 1967. I wanted to see if I could see a pattern when I compared it to Bitcoin. Lo' behold, I see one!
As you can see
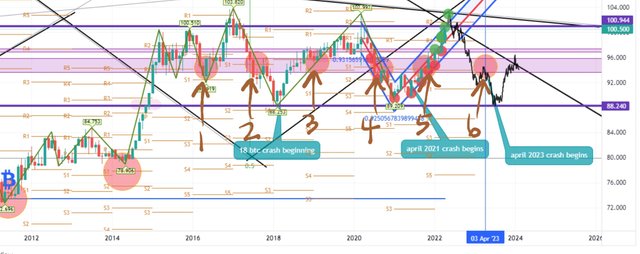
So I am focusing on from when Bitcoin was born, which was 2011.
This is what I discovered. The large red circles are when the US economy fell into a recession. As you can see, it happened 5 times in a row in history since 2016, so why not the 6th time? ( I placed a black line, which is a fractal, that happened in the past to easier see and understand where we might be in a year from now.)
Therefore, in my opinion and according to my findings, anybody calling for a USA recession right now is out of their mind. And I calculated that the next recession should be in April of 2023, not 2022.
A closer look (weekly)
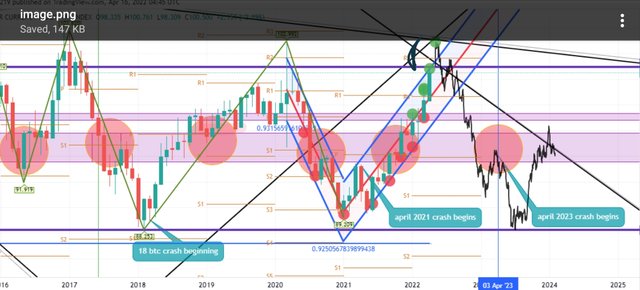
Let's look at the weekly chart.
The smaller red circles show where Buttcoin had major crashes. Do you see where they're located? At the bottom of the DXY, not at the top. All this time I believed that bitcoin would crash at the top, but that's not true. People would scream out, "the DXY is going down, so bitcoin will go down"... But actually there's zero truth to that. The fact is Bitcoin goes down AFTER the DXY goes down!!!!! 헐~
And so, this is why no one can predict the direction of bitcoin. Well, now it can be predicted because of decoding the puzzle.
It doesn't make sense that the composite man and large investors know the direction of bitcoin, and small retailers and private traders like us, CAN'T know the answer.
This is why I wanted to get to the bottom of this and figure it out.
The rich get richer, the poor get poorer.
It just doesn't make sense. But now I know, and now that I've told you, you know too.
A closer look (daily)
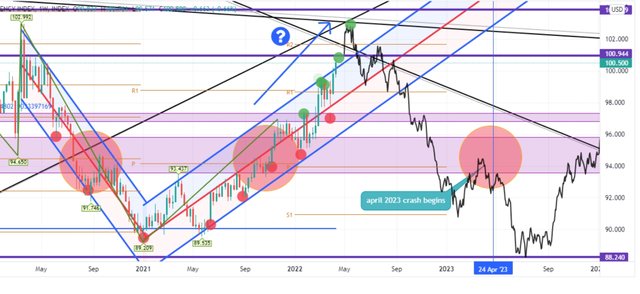
Let's zoom in and look at the DXY on the daily chart.
Sure enough, Bitcoin crashes happen at the bottom of the DXY, not the top. So if the Dixie is at the top (like it is right now), then there should be no decline in bitcoin.
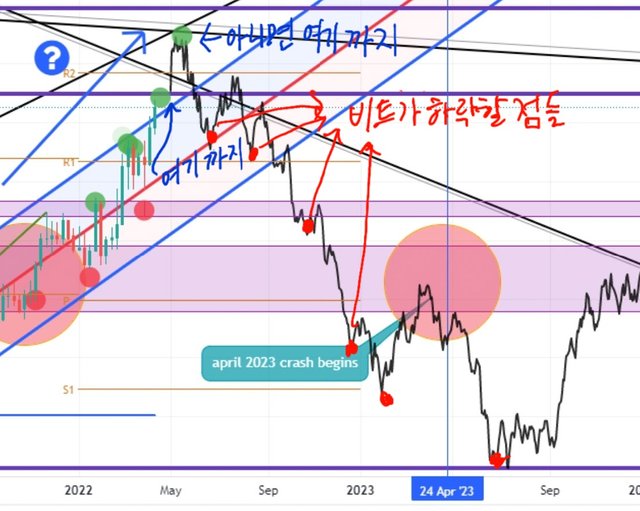
My analysis may be incorrect, however, at least I can now predict major crashes before they happen.
Upvoted! Thank you for supporting witness @jswit.

Please check my new project, STEEM.NFT. Thank you!