Gold Bubble Weekly Update #14

I am a day late with this post and that is mainly due to how fast the crypto markets have been moving. It might also have something to do with my waning confidence in my position. I am going to point out many different bearish factors in the post below, but keep in mind one thing...I am a long term bull who has been fully infected by the gold bug.
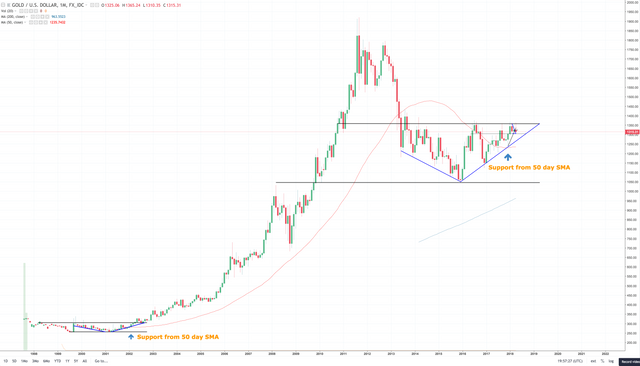
Originally I thought that the next bubble would happen in 2018 after the Fed’s started to hike the interest rates. It is starting to look like we are going to be delayed for another 2 years. However it does not look like we will miraculously avoid the inevitable collapse that was set up by quantitative easing.
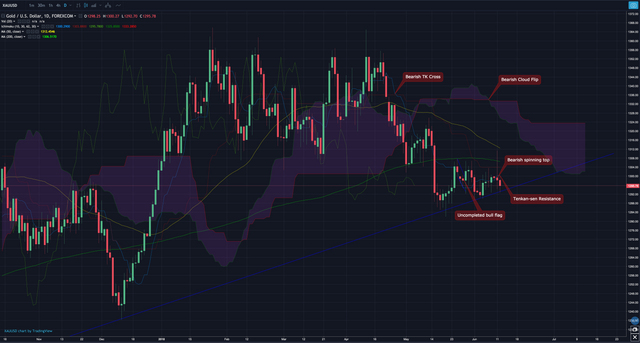
Daily Chart
Do not feel overwhelmed by everything on the chart, take a deep breath and go through it with me one step at a time.

Bear Market Checklist
Bearish Cloud X
Price Below Cloud X
TK Cross X
Lagging Span Below Cloud X
All signs point to Gold entering/continuing it’s bear market.
Price pulling back off yesterday's bearish spinning top
The uncompleted bull flag from 2 weeks ago is a very bearish signal
Resistance under the 200 day MA is a bad sign for bulls
Death cross from 50 & 200 day MA’s would lead to breakdown of trendline (blue). That would be final confirmation to sell and/or open a short.
Thank you for your time! When you like my content it makes me feel valued! After you click the follow I consider us friends! If you resteem then it counts as good karma!

After content like that, who wouldn't want more?
Personal Challenge - 0.1 > 1 BTC Trading Challenge - Day 94
Daily Commitment - BTC:USD 4 hour chart DAILY UPDATE (day 107)
Weekly Gold Update - Week #13
Poetry - Aliens | The Universe is a Hologram | Sunset
School - Intermediate Trading Strategy | White Paper Cliff Notes: AION | Intro to Indicators: Stochastic | Bitcoin Market Cycle