Gold Weekly Update (week 13)

Disclaimer: This is not meant as financial advice and is for entertainment purposes only.
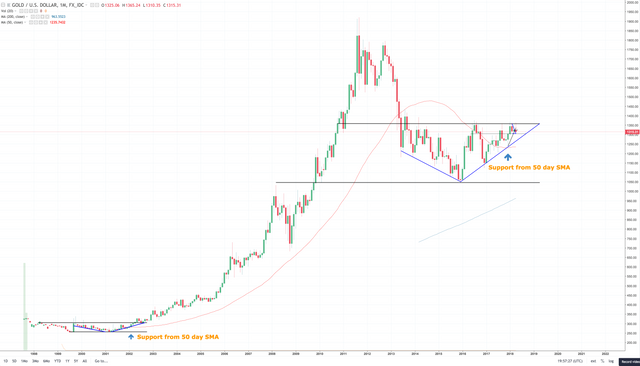
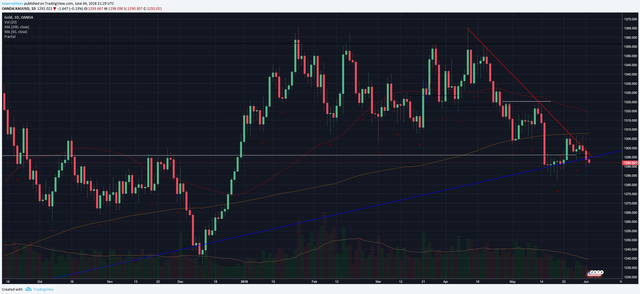
Last week we retested the bull trend line that started in November of 2015. We got multiple reversal dojis on the daily chart and it looked like we would be in for another bounce up to the key level of $1,350.

Since then we have proceeded to get shot down by the bear trend that started on 4/11. We still have yet to see a daily candle close below crucial trend line even though multiple candles have come within minutes of doing so.
Now we are looking at the bears best chance to get a close outside of the trend. If that happens they should start to build momentum. Furthermore the 50/200 day MA’s are posturing for the first death cross we have seen since November of 2016.
We also recently broke a down fractal on the daily. That is not expected to occur in a bull market and can be the first sign of bulls getting overwhelmed.

The 12 hour chart just formed another down fractal at $1,289 and it will be very interesting to see if we can hold above that. The last candle did close right below the trendline but it formed a nice dragonfly that we could get a bounce off of. We have already had multiple 12 hour candles close outside the trend so that doesn’t concern me nearly as much as the daily.
The death cross hit on this time frame back on 5/14 and provided a beautiful sell signal. Since then the 50 period MA has acted as strong resistance.
If that wasn’t all bad enough the S&P recently broke through major resistance (triangle and horizontal) and looks to be going for a retest of the all time high.

Will be keeping a close eye on how both asset classes proceed from here and expect the next 1-2 months to define the next 1-2 years. If the gold bubble waits until 2020 to take off then you better believe I will be ready to join the bubble happening at the S&P 500.
Comment if you have something to say. Smash the like if you are still reading and definitely finger that follow!

Want even more?
Check out the BRAND NEW Intermediate Trading Strategy!
Click here for last weeks post!
Here the BTC:USD 4 hour chart DAILY UPDATE!
And you definitely don’t want to miss the 0.1 > 1 BTC Trading Challenge!
Intro to Indicators
Bill Williams Fractals
Intro to Ichimoku Clouds
@CarpeNoctom's Top 5 Indicators
Chaikin Money Flow
Stochastic
White Paper Cliff Notes