Intermediate Trading Strategy

Listed in order of importance the factors that I consider are:
Volume
Momentum
Pressure
Trend lines & FIB levels
Candlesticks
Volume: Indicates flow of fiat into or out of asset.
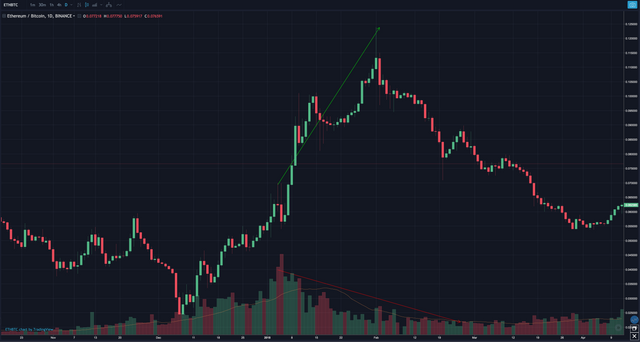
-If price is rising on falling volume then it is bound to correct, eventually.
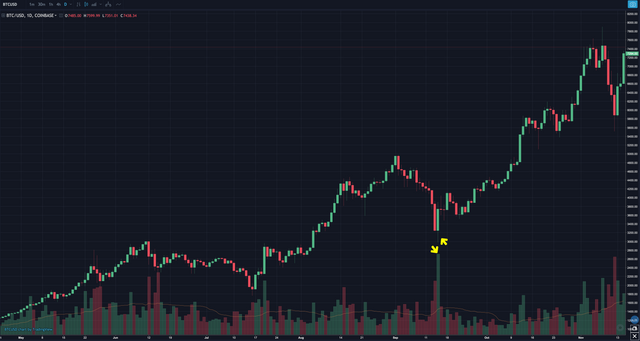
-If large volume + capitulation wick then highly likely to be a reversal
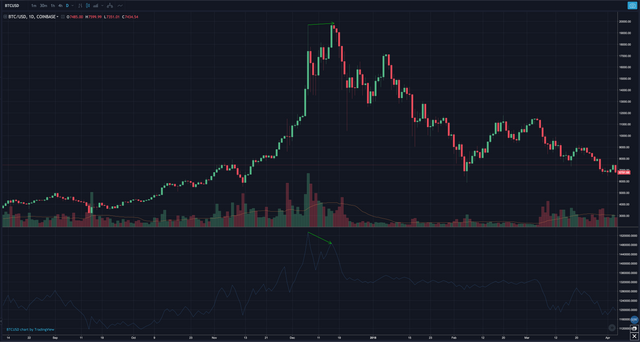
-Divergence in On Balance Volume (OBV) can indicate reversals
-If price is flat or falling in the face of rising volume then a rally is highly likely
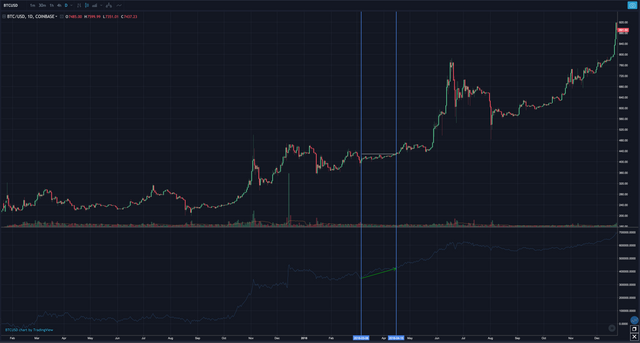
- Rally is highly likely If more money entering at support than selling resistance
Momentum: Bet on the trend, don’t expect it to end!
-RSI > 50 is like a football team crossing the 50 yard line. It is possible for them to score for their side of the field, but it is much more likely once they get past the 50.
-RSI < 50 and bulls are on the defensive while the bears are most likely to score.
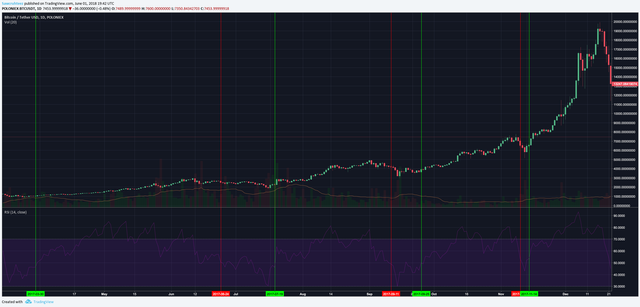
Green marks move above 50. Red marks move below. Would have done very well using this as primary indicator over last bull market.
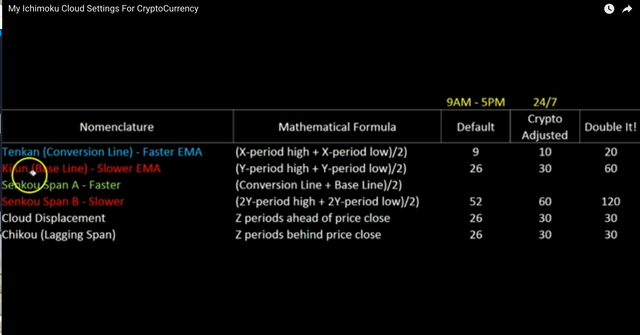
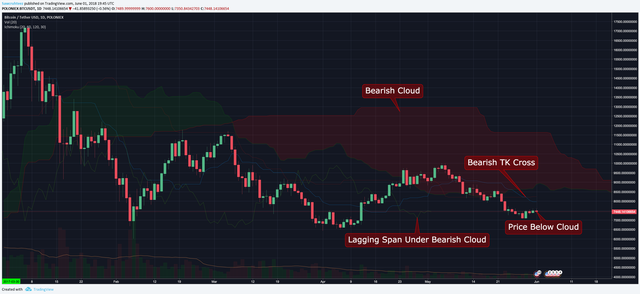
Ichimoku Cloud: Using @CarpeNoctom's checklist and settings
- Where is price in relation to cloud
- Is cloud bullish or bearish
- TK Cross
- Lagging Span
Pressure: Want to bet on momentum and trend, but do not want to buy when it is overbought or sell when it's oversold
Think of pressure as a short term overbought and oversold condition, independent of momentum. If bullish, look for short term oversold conditions for an entry.
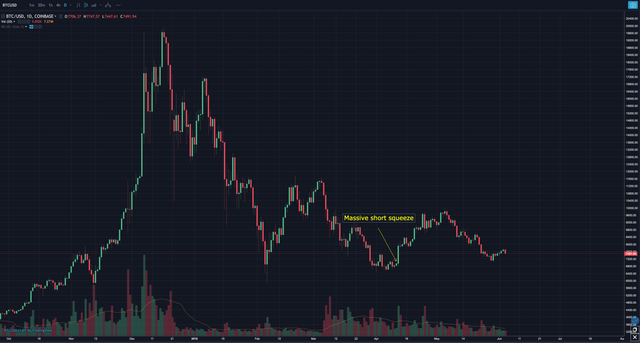
One of the best ways to measure pressure is the long/short ratio on Bitfinex.
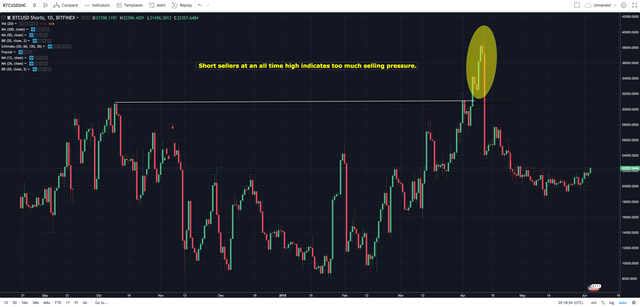
I was shorting around that time. After noticing how far out of equilibrium the short sellers were I was able to exit my position and predict the short squeeze that followed.
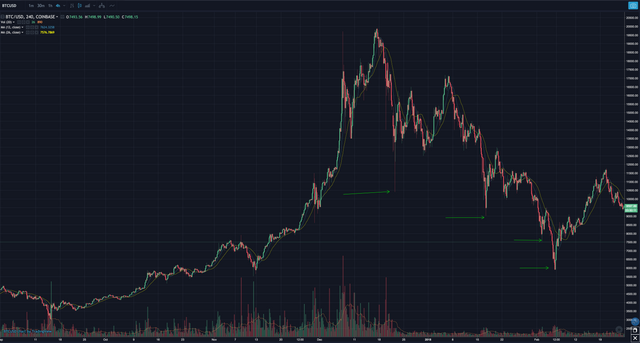
It is possible to remain oversold for a while, but not possible to be oversold forever. When price is too far outstretched in relation to the MA’s then it will eventually return to equilibrium, IF USING A HIGH ENOUGH TIME FRAME (1d-1w)
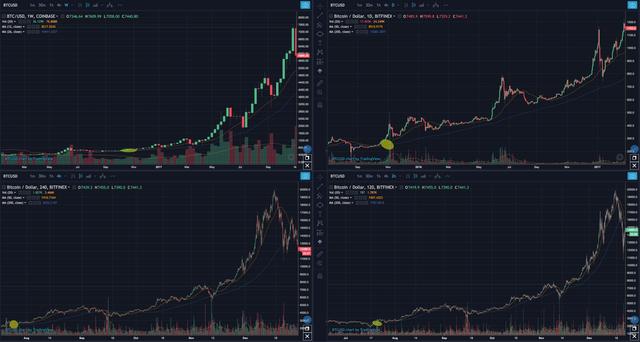
Moving Averages: All moving averages, up to the 50 & 200, need to be in a bullish posture (short term above longer term) for a bull market.
If short term MA is below long term MA on all time frames then it is a bear market
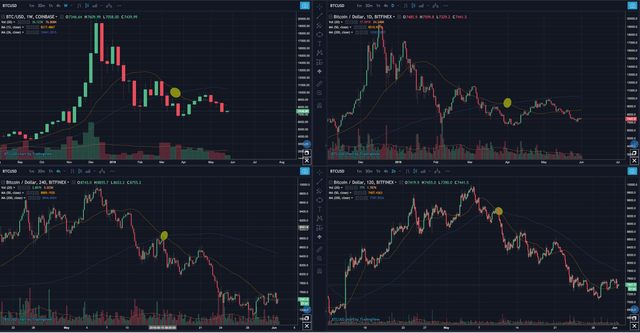
Longer term moving averages should be strong areas of support/resistance
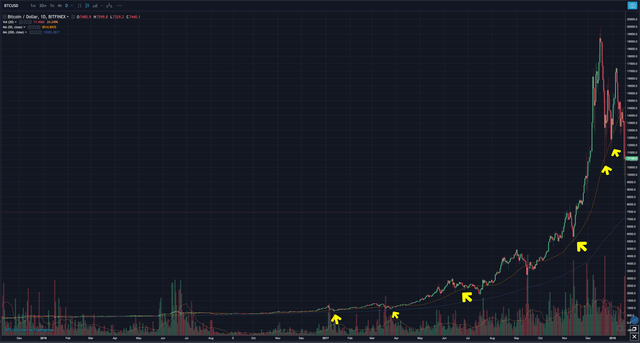
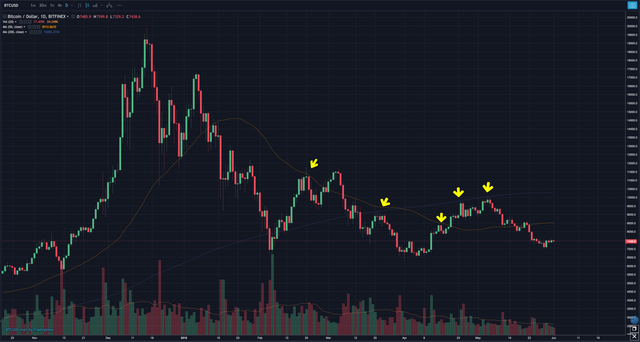
Shorter term MA's (12 & 26) can help indicate intra day and weekly pressure. Watch for the price getting too far away from short term MA’s. Picture stretching out a rubber band. It can be hard to know how far it will stretch before snapping.
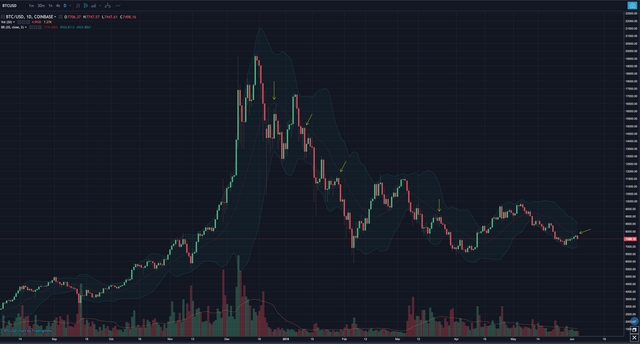
Bollinger Bands: provide a very good idea of how far the rubber band can stretch or how elastic the price is.
When price approaches top end of band it is expected to snap back to equilibrium.
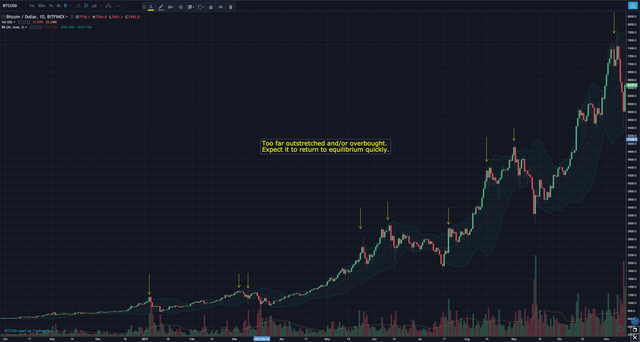
Same goes for when the price hits the bottom end of the band
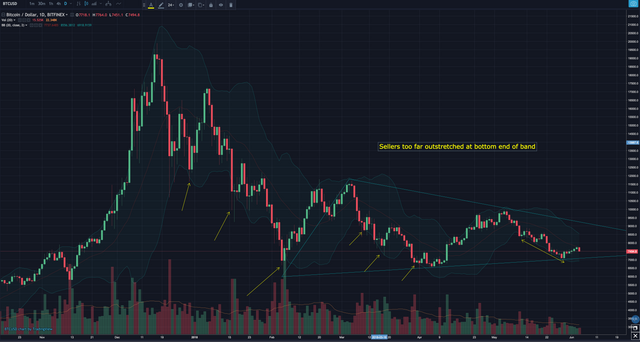
The center line is the 20 period moving average. In a bear market the price will find resistance at that level.
In a bull market the price should find support from the center line.
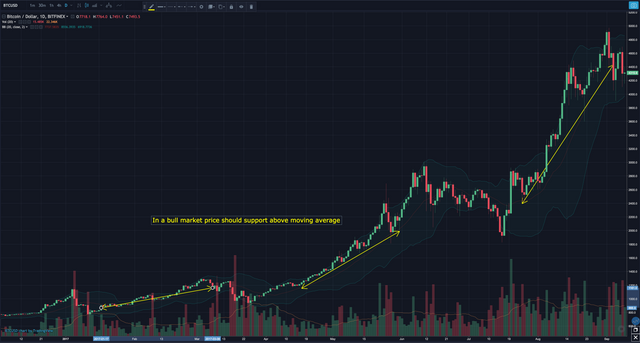
Bollinger Bands indicate pressure by showing when the price is too far out of equilibrium. Pressure can be a reason to pass up on an entry but is never a sufficient justification to enter in and of itself.
Assertion: It is extremely difficult to break a key level of support after being oversold similar to fighting a fire with a low pressure water hose. Likewise, It is just as difficult to break major resistance if already overbought.
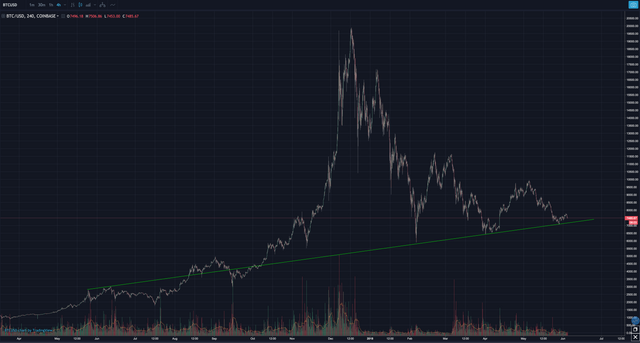
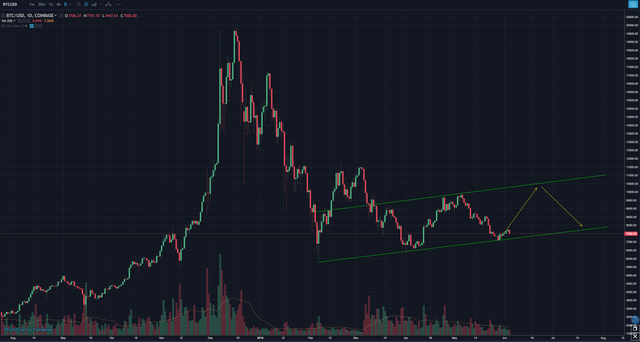
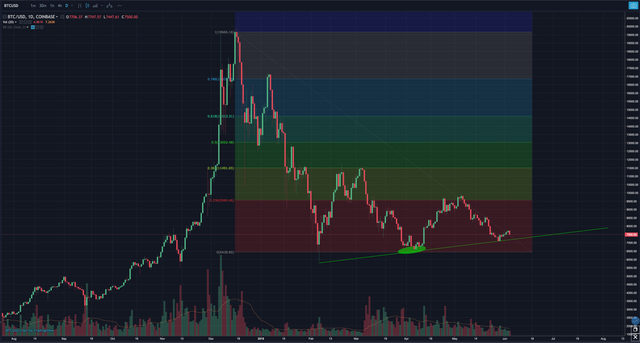
The green line is a key area of support that could be drawn all the way back to December of 2016 and we are currently oversold by most metrics.
Therefore I am expecting to see something like this:
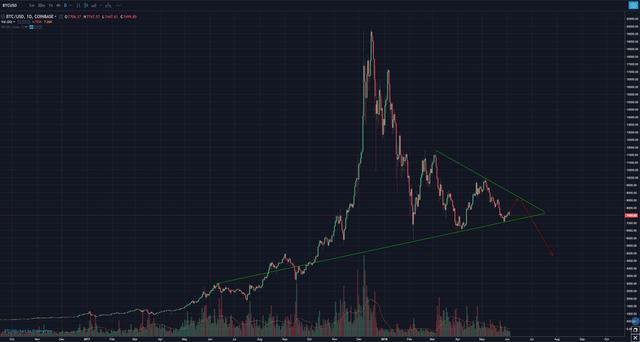
I am short term bearish and will be waiting to sell that bounce. That way I can bet on momentum without trying to fight a fire with a garden hose.
Entries
Buy oversold conditions in bull market
Sell overbought conditions in bear market
Trendlines and FIB levels
Fibonacci retracement levels and trend lines can help predict upcoming levels of support and resistance.
FIB
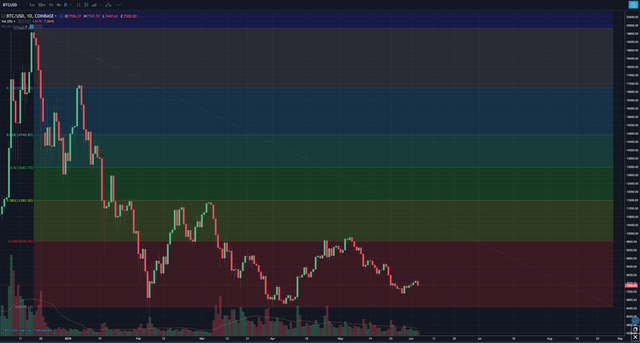
Trend lines
FIB & Trend support cluster
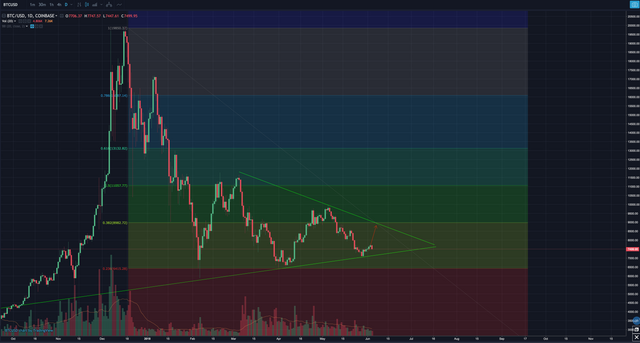
Potential upcoming resistance cluster
Entries:
Buy clusters of support. Sell clusters of resistance.
Candlesticks & Patterns
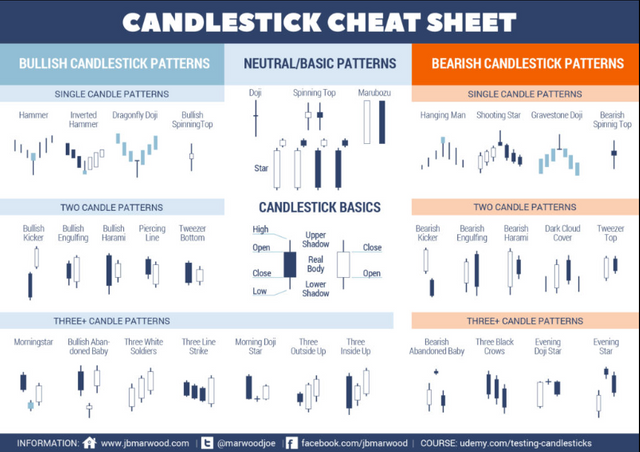
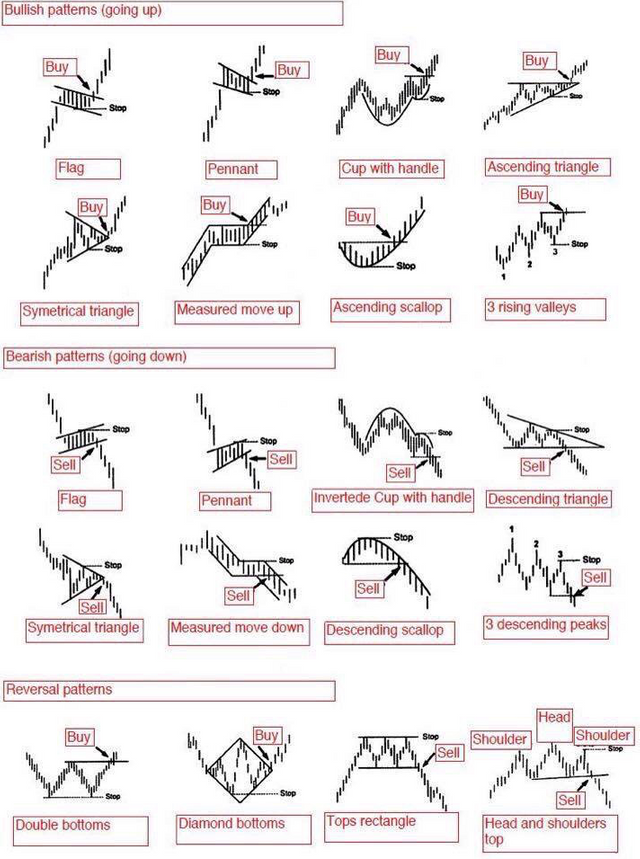
Source: Liberty Life Trail
Entries
Require confluence, such as a reversal doji at established support
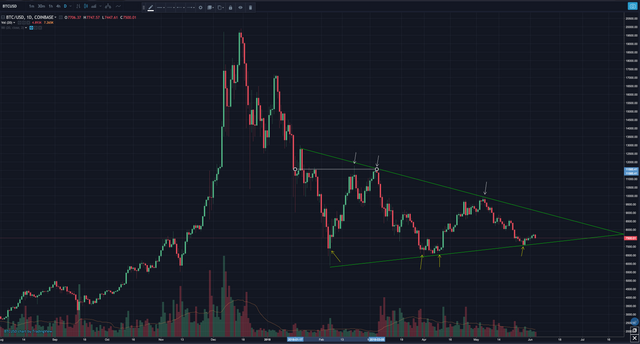
Sell reversal doji at resistance (white arrows)
Buy reversal doji at support (yellow arrows)
Wait for confirmation of chart pattern. Early = wrong.
It is possible to be a profitable trader by using some, all or none of these metrics. It all comes down to having a process and being consistent. Find the indicators/strategy that makes you feel most comfortable then learn how to implement a process day in and out.
Until next time trade happily and remember that likes/comments/follows/resteems are greatly appreciated!

Want even more?
Click here for the 0.1 > 1 BTC Trading Challenge!
Here the BTC:USD 4 hour chart DAILY UPDATE!
And you definitely don’t want to miss the next Gold Bubble!
Intro to Indicators
Bill Williams Fractals
Intro to Ichimoku Clouds
@CarpeNoctom's Top 5 Indicators
Chaikin Money Flow
Stochastic
White Paper Cliff Notes
Coins mentioned in post: