Steemit Crypto Academy Season 5 Week 5 [Beginner's Course] - Trading Using Wedge Pattern


Introduction
Hello everyone!
This is my third lesson as a Crypto Academy Professor and I am glad that I am sharing knowledge to you all. I welcome you all to the Fifth Week of Season 5 of Steemit Crypto Academy.
This Lesson is about Trading Strategy using Wedge Pattern.
In the Previous lectures, We studied about Recognizing patterns in Trading like Triangles, Flags and Rectangles. Now In this Lesson, We will learn about one more pattern in Trading which is Wedge Pattern.
Wedges
If We already attributed a nasty behaviour to Chart Patterns in the previous section, pay attention now to this Wedge Pattern. Wedges can also be very nasty patterns if you don't know how to trade this Pattern.
Wedge Patterns is a pattern which is marked by the convergence of the trendlines on the price chart. The trendlines are drawn in respect to make a Wedge pattern. We can call upper trendline as Resistance and lower trendline as Support.
Wedge Patterns shows a pause in the ongoing trend in the market. This Pattern is determined by the contraction of trendlines in the price chart.
This Pattern is formed at the top or mid of the trend. After the formation of this Wedge Pattern, Price takes reversal from that point and then, Traders can take entry or exit after the formation of this Pattern.
There are two types of Wedge Patterns -
- Rising Wedge
- Falling Wedge
Let's talk about both these types of Wedge Pattern in detail.
Rising Wedge
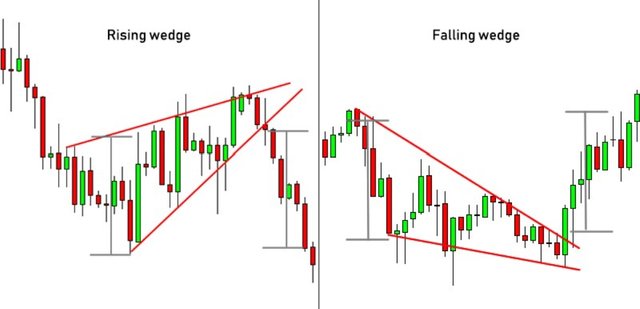
Rising Wedge can also be named as a bearish version of Wedge Pattern. It can be recognized by it's upward tapering shape.
A Rising Wedge is formed after the consolidation of the price between both trendlines. It is considered as an upward price trend bounded by two intersecting, up-sloping trendlines.
A Rising Wedge is considered as a bearish chart pattern with the trendlines slope up which means after the formation of Rising Wedge, Price will move in downward direction after certain breakout.
When Rising Wedge is formed after an Uptrend, then there comes a reversal in the price movement which is usually a Bearish reversal i.e. price will move downward.
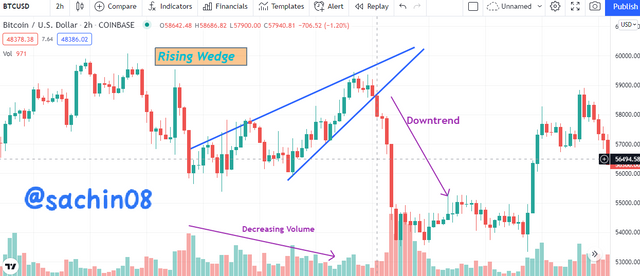
The above image shows an example of a rising wedge. The Rising Wedge Chart pattern has formed around the bottom. Prices came off the prior high, rounded about and then headed up.
The side to side oscillations bounded by the two up sloping trendlines gave a clue to the formation of this pattern. The decrement in volume shows that the pattern was indeed a rising wedge.
Generally, Rising Wedge forms at the end of an uptrend but sometimes, During downtrend, Rising Wedge forms as a retracement in the price and after the breakout in rising wedge, price resumes falling.
A Rising Wedge which forms after an Uptrend usually leads to a reversal (downtrend) while a rising wedge which forms during a downtrend can be considered as continuation in trend.
How to identify Rising Wedge?
Rising Wedges are not very easy patterns to identify. However, I will tell you some guidelines that can help you in identify Rising Wedge easier.
| Characteristic | Discussion |
|---|---|
| Two up-sloping trendlines | Draw two trendlines, one along the minor highs and one along the minor lows. Both trendlines must slope in upward direction and should intersect. |
| Multiple touches | Rising Wedge must have multiple touches at the both trendlines. Rising Wedge must have atleast total of 5 touches, 3 on one trendline and 2 on other trendline. |
| Volume trend | Volume basically trends downward in the formation of Rising Wedge |
| Breakout Volume | Breakout Volume can be either heavy or light but is generally below average. |
The above table shows the identification guidelines for identifying a Rising Wedge Pattern. Rising Wedge can form anywhere. You might expect them to form at end of an uptrend.
Falling Wedge
Falling Wedge precisely known as Bullish version of Wedge Pattern. This Wedge can be recognized by it's downward tapering shape.
At first glance, such a price pattern looks quite bearish but this is actually a very bullish pattern, as the price target is the upper beginning of the pattern.
Falling Wedge is generally forms at the end or bottom of downtrend which results in starting of an uptrend which is considered as a reversal.
When Falling Wedge forms during an uptrend, then this Wedge is for retracement in the price and then it resumes movie in upward direction and this is considered as a continuation signal.
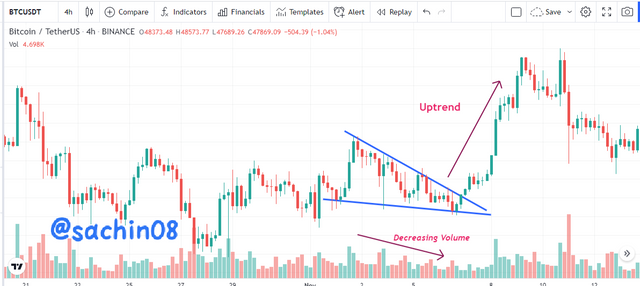
The above images shows an example of a Falling Wedge.
How to identify Falling Wedge?
Falling Wedges are not very easy patterns to identify. However, I will tell you some guidelines that can help you in identify Falling Wedge easier.
| Characteristic | Discussion |
|---|---|
| Two down-sloping trendlines | Draw two trendlines, one along the tops and one along the bottoms. Both trendlines must slope downward and eventually intersect. |
| Multiple touches | Falling Wedge must have atleast total of5 touches, 3 on one trendline and 2 on other trendline. |
| Volume trend | Volume generally trends downward |
The above table shows guidelines to identify a Falling Wedge. There should be minimum five touches to safeguard a good formation of the wedge pattern.
Trade Setup using Wedge Pattern
The price targets of both these wedges turn out be a little complex from what is known so far. In addition, they are bit more difficult to calculate, because here your own drawing somehow influences the target. Therefore, Verify the target after the breakout.
- Trade Setup using Rising Wedge
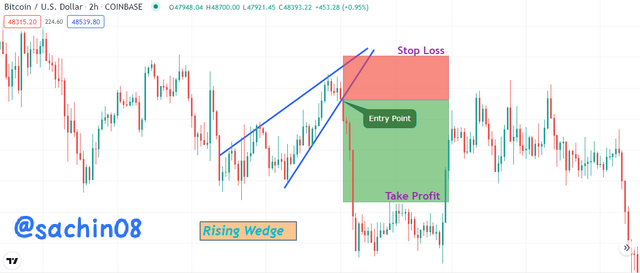
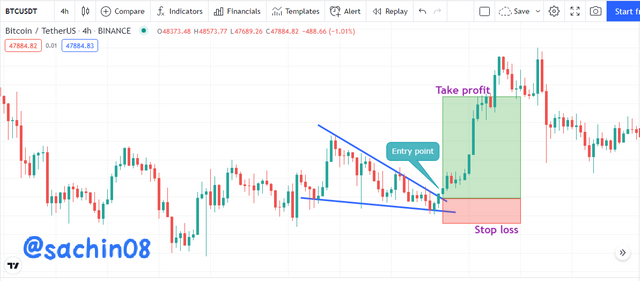
From the above image, We can see that a Rising Wedge is formed which is touching both trendlines and when it breaks the Support line, the Point becomes our entry point. At the time of Breakout, We can take our entry and then We can mark Take Profit level and Stop loss level just above the tip of the wedge or just above the resistance line.
- Trade Setup using Falling Wedge
From the above image, We can see that a Falling Wedge is formed which is touching both trendlines and when it breaks the Resistance line, the Point becomes our entry point. At the time of Breakout, We can take our entry and then We can mark Take Profit level and Stop loss level just below the tip of the wedge or just below the Support line.
Conclusion
Through this lesson, I have explained you about Wedge Pattern in detail. If you are able to identify a Wedge Pattern, then It is easier for you to trade them and book your profit after the breakout happens in the wedge pattern.
Thank You for reading my lesson. If there are any error in writing, then please let me know in comments. Feel free to ask in the comment section if you have any query.
Homework Task
Make Sure you understand the lesson before performing the homework task. Also, you are required to attempt all the questions and make use of your own Crypto chart.
1. Explain Wedge Pattern in your own word.
2. Explain both types of Wedges and How to identify them in detail. (Screenshots required)
3. Do the breakout of these Wedge Patterns produce False Signals sometimes? If yes, then Explain how to filter out these False signals.
4. Show full trade setup using this pattern for both types of Wedges.( Entry Point, Take Profit, Stop Loss, Breakout)
5. Conclusion
Homework must be posted in Steemit Crypto Academy community. Your homework title Format should be "[Your Title] - Crypto Academy / S5W5 - Homework Post for @sachin08".
Plagiarism is a great offense in Steemit Crypto Academy and it won’t be tolerated. Ensure you refrain from any form of plagiarism.
Your post should not contain less than 500 words.
All images, graphs, and screenshots from external sources should be fully referenced, and ensure to use watermark with your username on your own screenshots.
Use the tag #sachin08-s5week5, #cryptoacademy, #club5050 if eligible and your country tag among the first five tags. Also include other relevant tags like #chart, #trading #pattern.
Homework task will run till Saturday 11:59 pm December 18th UTC Time.
Only users with a minimum of 300 SP and having minimum reputation of 55 are eligible to perform this homework. Also, note that you must not be powering down.
Users who have used upvote tools to gain SP or build their reputation are not eligible for this homework.
To take part in the Academy you must have powered up a minimum of 150 STEEM in the past month for #club5050 eligibility.
Note - You can only drop your homework link in the comment section if not reviewed after 48 hours.
Cc:-
@steemitblog
@steemcurator01
@steemcurator02
Greetings sir.
Please you have graded my work and i miss the mark for club5050 i have successfully powered up 150 steem sir.
Please review this is proof to show.
This is the post link sir.
STEEMIT CRYPTO ACADEMY:: HOME WORK POST FOR PROF. @sachin08 ON::TRADING USING WEDGE PATTERN:: BY @gi-de-on.
I am sorry for the stressed caused so far.
Thanks in anticipation
Sir if i delegate my 600 SP for steemfood community then i could be able in season5 week5 class.
Yes, You can delegate.
No problem.
One of my kind 😌.
You nailed it professor @sachin08.
But the third question please explain better
Do these patterns produce false signals sometimes?
You have to explain this if it is yes.
Ok prof. Noted
Thanks a lot
Will soon drop my assignment 🤗
Please prof. @sachin08 ,I am so sorry for the stress, please kindly look into this. Thank you
https://steemit.com/hive-108451/@merci26/trading-using-rectangular-pattern-steemit-crypto-academy-s5w4-homework-post-for-sachin08
Professor, this post has been 5 days, but it hasn't been curated.
https://steemit.com/hive-108451/@maepoong/trading-using-rectangle-pattern-crypto-academy-s5w4-homework-post-for-sachin08
great
https://steemit.com/hive-108451/@elian23khan/trading-using-rectangle-pattern-crypto-academy-s5w4-homework-post-for-sachin08
Hello professor @sachin08
I think there is a mistake regarding the time here
Thanks for pointing it. It has been corrected now.
Hello Professor.
I wanna clear that in this screenshot
Will this not be our exit point instead of the entry point?
Why will we enter the market at the time of breakout if the market is going down?
please correct me
We can enter in the short position as we know that price will move downward.
Prof you marked me wrongly check
https://steemit.com/hive-108451/@sachin08/r40mjz
I am an active Club5050 member
Bro for #club5050 elegibility, you must transfer at least 150 steem to vesting. Thus, a minimum of 150 steem power-up for each month, but it seems your transfer to vesting is 139 instead.
Hi prof. My assignment has been graded but not voted and will expire tomorrow. Please help me out. This is it
https://steemit.com/hive-108451/@zology69/rectangle-pattern-crypto-academy-s5w4-homework-post-for-sachin08