Trading Using Rectangular Pattern-Steemit Crypto Academy -s5W4- Homework post for @sachin08

In the financial market, the actions of traders (buying and selling) usually decides the direction of the market (trends), and these trends are usually depicted in charts that helps traders carry out market analysis. Charts can appear in different ways and assume different patterns, and it is important to note that these patterns formed as a result of trading actions are significant, affirming the significance of "Technical Analysis", today. In this interesting task by the esteemed Prof. @Sachin08, we will be looking at rectangle patterns and how they can be used. Below is my completion of the homework task by Prof. @Sachin08.


A rectangle pattern in simple terms is a technical analysis pattern that forms on a chart that when plotted using trend lines, appears like a rectangle as both lines run parallel to each other in a horizontal fashion.
Rectangle patterns emerge when the price of an asset trades inside a restricted range with parallel levels of resistance and support, matching the shape of a rectangle. A rectangle pattern is a continuation pattern that appears on an asset's chart when the price remains constrained in a zone after it has been going in one direction.
When this rectangle is established, it aids traders in determining the market's next trend movement.
Rectangle patterns could exist in two forms:
- Bullish Rectangle Patterns: This rectangle pattern is denoted by "B" in the chart above, and it appears following a downtrend movement.
- Bearish Rectangle Patterns: This rectangle pattern is denoted by "A" in the chart above, and it appears following an uptrend movement.

Now, let's see how rectangles can be identified in a trading chart.
- The first and common way to do this is to observe the trading chart for the absence of an obvious trend formation. Normally, two trends can be formed on a trading chart based on the market direction - a bearish trend/downtrend when the price of assets are falling, and a bullish trend/uptrend when the price of assets are appreciating. To identify a rectangle pattern, simply look for the absence of these two trends, then, probably, you may discover a rectangle pattern. Here is a snappy and pragmatic example:

Source - TradingView
- Another way to identify rectangle patterns in a trading chart is through the use of horizontal trend lines. If the presence of a rectangle pattern is observed at any point in a trading chart, these horizontal lines can help a trader affirm this. To use this strategy, simply drug a horizontal line above the chart area (resistance) and below (support line). A rectangle pattern can be affirmed if the support line meets with at least two points (two lows) in the chart and the resistance line meets with at least two other points (two highs) within the resistance area and the trend line appears like a triangle. A minimum of four points (two highs and two lows) must touch the upper and lower trend lines.

Source - TradingView

We can definitely use indicators with the rectangular trading pattern. Indicators could be used to verify the direction of a trend along with the formation of the rectangular pattern. With the use of indicators along with the rectangular patterns, we can get more accurate results in the formation of rectangular patterns. Here are some indicators that could be applied to a rectangular pattern chart:
- Half trend Indicator
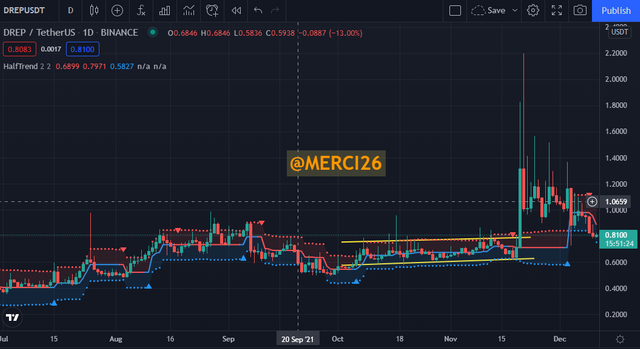
Source - TradingView
The half trend indicator has been applied to the chart above.
The Half Trend is an indicator that estimates the "High" and "Low" price maximums and minimums. The Half Trend is a market trend detecting tool based on Moving Averages that is suitable for all trading strategies. At the same time, this indicator can signal both the trend and the trade. This indicator might help you find good entry points. To disregard erroneous signals induced by rapid price swings over a short period of time. - Bollinger Bands
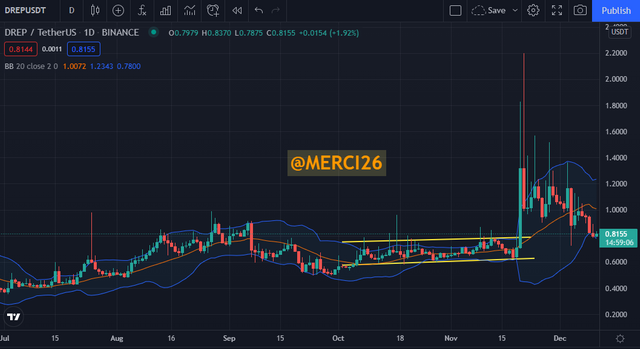
Source - TradingView
Bollinger bands can be used in conjunction with rectangular patterns to assist detect whether prices are relatively high or low. Upper and lower bands are employed in pairs to validate signals generated by other indicators. - Chaikin Money Flow
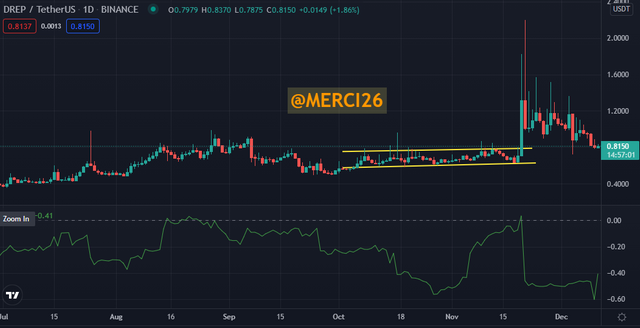
Source - TradingView
The Chaikin Money Flow indicator can be paired along with the rectangular patterns to confirm the direction of a trend.


Rectangle Tops
Rectangle tops are rectangle patterns that form in a chart following a strong bullish/uptrend. This rectangle pattern only appears following a strong bullish trend. Here is an example of rectangle top:

Source - TradingView
Rectangle Bottoms
This are the opposite of rectangle tops. They are rectangle patterns that forms following a bullish/down trend.
Here is an illustration of this:

Source - TradingView

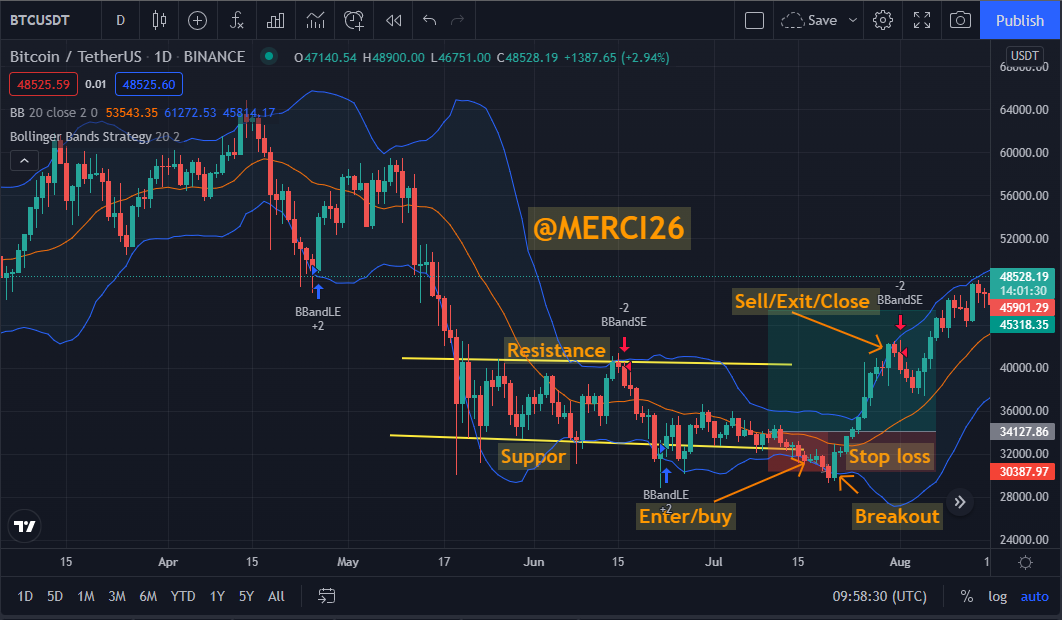
Trading Setup for a Bullish Trend Using the Rectangle Pattern

Source - TradingView
From the trading setup above, trade is placed below the breakout point. We took profit from the top of the uptrend area and placed stop loss below and within the buying position. The bollinger band indicator was applied to confirm trend.
Trading Setup for a Bearish Trend Using the Rectangle Pattern
Source - TradingView
From the trading setup above, trade is placed just before the breakout point. As with each rectangle pattern, a trend shift is expected. We took profit from the top of the uptrend area and placed stop loss just before the uptrend is expected. The bollinger band indicator was applied to confirm trend.

So far so good, it has been established that different patterns may form in a trading chart. From the previous class, the triangle patterns were identified, and in this class we delved in deep into the rectangle patterns. Chart patterns could be somewhat reliable for spot trading, however, it is recommended that other indicators be paired with the formation of these patterns to help confirm trends and reduce risks in trading. Thanks once again at Pro. @Sachin08 for the development of this lesson, I look forward to your next lecture.
