Rectangle Pattern - Crypto Academy / S5W4 - Homework Post for @sachin08
There are many patterns in the market we use in the market. In our last lecture with prof @sachin08 we talked about one of them, the triangle pattern. This week we are talking about the rectangle pattern. I will be explaining my response to the homework assignment questions in my publication here.
1. Explain Rectangle Pattern in your own word.
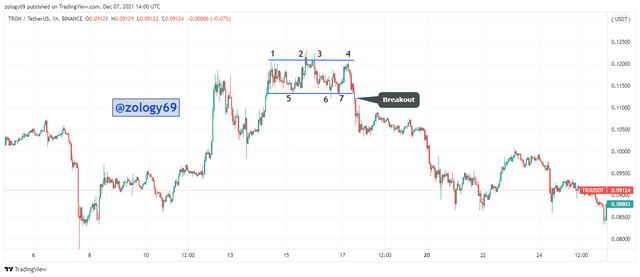
We know that there are generally 2 trends in the market: uptrend and downtrend. However during these 2 trends, there comes a trend exhaustion period of price consolidation where price is not exactly moving in a trend, but trading within a small margin or range in a rectangular consolidation. It would seem as if price is in a range at this point. This is where the Rectangle Pattern forms. In my own opinion, I see this pattern mostly forming when price is in an accumulation or in a distribution.
The Rectangle Pattern consists of 2 lines, one a flat horizontal resistance above price movement called the top trendline , and the other a flat horizontal support below price movement called the bottom trendline. These 2 trendlines forms the rectangle pattern. Price trades moving to or near the resistance (top trendline), and back down to the support (bottom trendline), and never outside the rectangle.
When price trades outsides or exits the trendlines of the rectangle, a breakout is said to have happened and the rectangle pattern becomes invalidated. If price exits the rectangle above the top trendline, an upward breakout has occurred, and a downward breakout if price exits the rectangle at the bottom trendline.
2. How to identify Rectangles. Explain with Screenshots
When looking for rectangles, we need to consider the trend that led to the formation of the triangle. Uptrends lead to the formation of Rectangle Tops and likewise, downtrends lead to the formation of Rectangle Bottoms.
Also, we need to check to see if price is actually moving or bouncing between two horizontal trendlines. These trendlines are important as they are the defining structure for the rectangle pattern. A Rectangle Pattern is valid only if price moves to and from a resistance top trendline and a support bottom trendline.
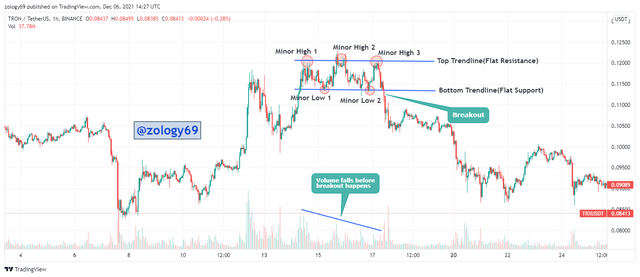
To identify the top trendline, we connect the minor highs of the horizontal prize movement, and we connect the minor lows of the horizontal price movement to obtain the bottom trendline. Because these trendlines are acting as resistance and support, there must be at least 2 points of contact or reaction with price along each of these lines.
It is important to know that these points might not completely touch the trendlines, but must at least move close to it, must stretch across the length of the rectangle and not be one-sided or heavily concentrated at one point, leaving another.
We normally should also see volume reacting before the breakout happens. The volume reaction differs based on the rectangle type. For a rectangle top, we will see volume fall of before the breakout happens. However, for a rectangle bottom, volume tends to move in the breakout direction.
3. Can we use indicators with this pattern to get accurate results? Explain with Screenshots.
Yes, we can use technical indicators to increase results obtained from the rectangle pattern. I will be using the RSI indicator to explain. Let’s understand the RSI indicator first. How does it work?
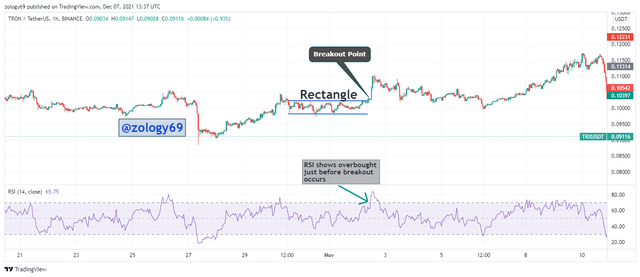
The RSI indicator has two lines, 30 and 70, the 30 line indicating an oversold region and the 70 line indicating an overbought region. If the RSI goes above 70, that means there is or will be a spike up in price which should be followed by a reversal. If RSI goes below the 30 line, there is or will be a fall in price followed by a reversal to the upside.
In the TRXUSDT chart above, we can see that as price breaks out of our rectangle pattern, the RSI goes above 70, indicating that there will be a spike up, which is indeed the breakout we see happen in the chart above.
4. Explain Rectangle Tops and Rectangle Bottoms in your own words with Screenshots of both patterns.
During the formation of rectangle patterns, the location of the rectangle relative to the trend is very important in classifying the rectangle pattern. Based on the location of the rectangle on the trend, we have Rectangle Tops and Rectangle Bottoms.
- Rectangle Top
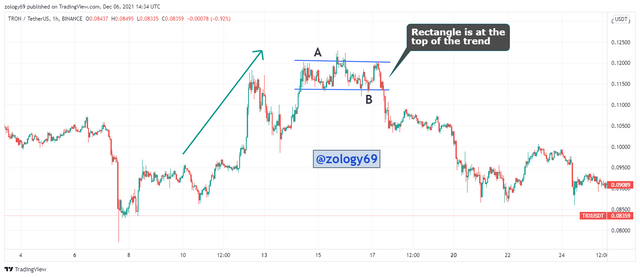
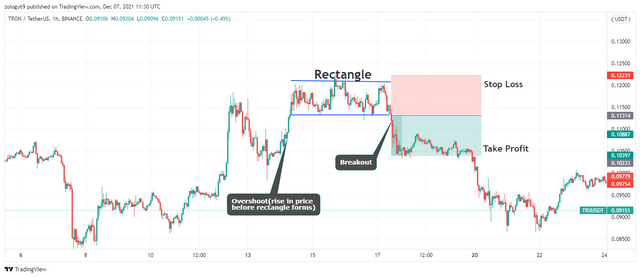
For a Rectangle top, the rectangle forms at the top of the trend. You will normally find the rectangle top at the top of an uptrend before price reverses. In a rectangle top, price trades between the flat resistance and support (top trendline and bottom trendline) until it breaks out in the downward direction. The breakout for a rectangle top happens in the downward direction below the flat support line.
In the TRXUSDT chart above, we see that the rectangle pattern is rectangle top as the rectangle forms at the top of the uptrend. The uptrend leads into it. Whiles the rectangle is formed, price trades inside the rectangle between the top trendline A and bottom trendline B, until it eventually breaks out in the downward direction below the bottom trendline labelled B.
- Rectangle Bottom
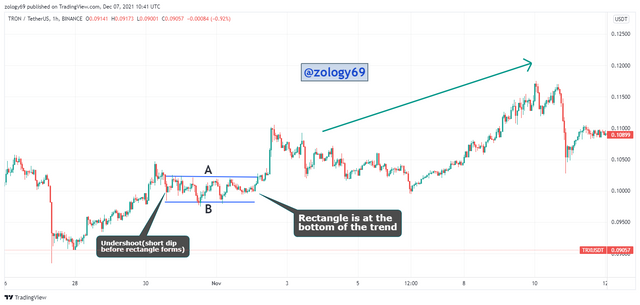
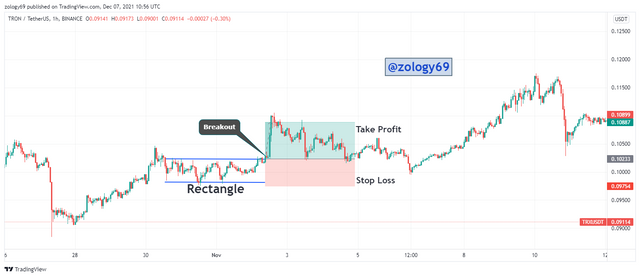
Just like the name suggests, a rectangle bottom forms at the base or bottom or beginning of a trend. It usually forms at the base of an uptrend just before the uptrend begins or during a downtrend at the bottom of the trend. After the rectangle forms, price trades inside the rectangle between the top trendline A and bottom Trendline B, until it eventually breaks out in the upward direction if it is forms at the base of an uptrend, or in the downward direction if it forms during a downtrend.
In the TRXUSDT chart above, we see that the rectangle pattern is a rectangle bottom as the rectangle forms at the base of a starting uptrend and forms after an undershoot. Whiles the rectangle forms, price trades inside the rectangle between the top trendline A and bottom trend B, until it eventually breaks out in the upward direction above the top trendline labelled B.
5. Show full trade setup using this pattern for both trends. ( Entry Point, Take Profit, Stop Loss, Breakout)
Sell Trade Setup For Rectangle Top
In the TRXUSDT chart above, we spot a rectangle top pattern. We observe how price is trading inside the rectangle between the top and bottom trendlines of the rectangle until it breaks out in the downward direction. The breakout point is where I make my exit. To manage the risk of my trade, I place stop loss slightly above the top trendline and take profit to be in a 1:1 R:R ratio.
Buy Trade Setup For Rectangle Bottom
In the TRXUSDT chart above, we spot our rectangle bottom pattern. We observe how price is trading inside the rectangle between the top and bottom trendlines of the rectangle until it breaks out in the upward direction. At the breakout point is where I make my entry. Risk management is essential to execute successful trades with minimal loss and maximum profit so I place my stop loss slightly below the bottom trendline of my rectangle, but I place a wide take profit this time.
Aside technical indicators, we can use simple patterns formed by the candlestick chart to make analysis of the market and anticipate price market. An example of these patterns is the triangle pattern which we treated in our last lecture and the rectangle in this weeks lecture. We learnt last week that there are 3 different types of triangles and this week that there are 2 types of rectangles: Rectangle Tops and Rectangle Bottoms based on their location on the trend. For more successful trades, it is better we combine our rectangle pattern with an indicator for confluence.
CC: prof @sachin08
