STEEMIT CRYPTO ACADEMY:: HOME WORK POST FOR PROF. @sachin08 ON::TRADING USING WEDGE PATTERN:: BY @gi-de-on.
GREETINGS EVERYONEBest Regards to everyone participants and all the professors including the curators. It is yet another week, I pray that this week be filled with all the wonderful blessings of God for us all. May our encounter this week be better than what we had last.
INTRODUCTION.png)
[edited in canvas]
All thanks to God for the opportunity to part in this week's homework post. For the previous week we were opportune to learn about TRADING RECTANGULAR STRUCTURE, hence, for this week's lesson is simply on TRADING WEDGE STRUCTURES, you will notice that all these are simple strategies and patterns in which we can apply to carry out successful trading. Therefore, for the purpose of this homework post, the topic would be therefore discussed in detail in the subsequent paragraph below.

Explain Wedge Pattern in your own word.
Just like every other pattern that can be found on the price chart of an asset, you will agree with me that all these patterns are simply gotten through the continuous formation of the trendline. Hence, I would say the trendline is simply a base at which all these patterns are gotten. This is no different from the Wedge pattern. There are simply gotten from the formation of the trends lines on a price chart of an asset whether it be bullish or a bearish trend.

In a price chart of an asset, the wedges pattern simply shows the pause and continuation of an asset price. As earlier said, these patterns are simply gotten by the successive formation of the trendlines on a price chart.
The formation of these patterns which can be gotten from a bearish or bullish trend can simply start its formation from either the top of the trend or at the middle of a trend.
For me basically, I will say this wedge pattern happens are as a result of the false breakouts that are present in the price chart of an asset.
In a nutshell, I will conclude by saying these patterns are simply characterized by the various ranges of the price system of an asset which is accompanied by the uptrend of the price and the downtrend in the price of the asset.
Explain both types of Wedges and How to identify them in detail. (Screenshots required)Basically, there are two (2) types of Wedges which are Namely:
- The Rising Wedge (uptrend)
- The Falling Wedge (Downtrend)
This would therefore be discussed in detail below.
THE RISING WEDGE
When talking about rising in crypto trading, what comes to mind first is simply bull. With this gotten, it would therefore be easier to establish or explain the term.
Basically, a Rising Wedge is been considered as an uptrend which is generally represented by what is known are a Bullish trend. Therefore, the rising wedge is simply gotten or formed from the uptrend of a price chart of a cryptocurrency asset.

[screenshot from tradingview]
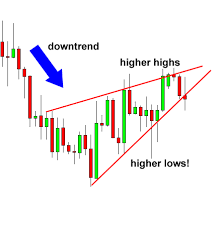
A rising wedge is easily sported reason been that after the rise of these assets, there following trend bearish which is the downtrend of an asset. Furthermore, the rising wedge is simply formed on a price chart when the price of the traded asset continues in the bullish formation by forming higher highs and also higher lows. Once this pattern is been displayed on an uptrend/bullish trend, it, therefore, means that the trend is losing its strength and is likely to fall or dip.
HOW TO IDENTIFY RISING WEDGE
There are several ways in which a rising wedge can be identified, some of them are therefore listed below.
The presence of two-up trendlines: Hence, since the formation of the rising wedge is been characterized by the formation of higher highs and higher lows been present in the market chart. This implies that both the trend lines been drawn are definitely going to slope upward indicating that there is an uptrend in the chart.
Presence of Multiple Touches: Just like in the Rectangular structures, where the rectangles formed must pass through the resistance and support line touching at both ends. This is simply applicable here where the bullish trend must touch the two uptrend lines that are drawn to indicate/show the presence of the rising wedge.
Volume in trend: During a rising trend, the reverse trend that comes into play is simply a bearish trend that happens to be in volume.
FALLING WEDGE
This is the direct opposite of the Rising wedge. These have to do with the downtrend that is formed on a price chart. Hence there is a bearish trend generally.

[screenshot from trading view]
The falling wedge which is always formed at the end of a bearish trend hence gives rise to a bullish trend after the pattern is formed. When the falling wedges are simply formed on the price chart of an asset it, therefore, means that there is simply going to be a reversal of the market trend (retracement). This is to say that the bearish trend will simply end and then allow the bullish trend to take over the market.
The falling wedge is simply the successive combination of the Lower highs and the Lower lows that are formed on the price chart of an asset.
HOW TO IDENTIFY FALLING WEDGE
In the identification of a falling wedge, there are quite not easily spotted in the price chart but for easy identification, below are the guidelines to be observed.
Similarly to the Rising Wedge, there are two down-sloping trendlines: The formation of the falling wedge which is characterized by the formation of the Lower lows and lower highs. This, therefore, implies that both the drawn trendlines are definitely going to slope downward.
Presence of multiple touches: As it is applicable to Rectangular patterns discussed last week, this is applicable to the falling wedge, the formation of this wedge is therefore considered to touch each end of the downtrend slope.
Volume in Trend: In the downtrend that is present in the price chart of an asset, this implies that there is a higher volume present in the falling trend.
Do the breakout of these Wedge Patterns produce False Signals sometimes? If yes, then Explain how to filter out these False signals.YES…!!
I will say that there is always a false breakout been present on the price trend of any traded crypto asset. You might ask where can this false break out be identified. You will notice most time in the falling wedge, when the price is undergoing a bearish trend there seems to be the presence of false breakouts which do not last for long. This false breakout can simply last for two (2) days.
False breakouts that are present on a price chart of an asset simply show weakness in the trend. This is a sign to show that there might be a new trend formation soon or there might simply be a formation of stronger holds (resistance level).
Hence, once any false breakout is been identified in the price chart of the traded asset, a wise trader who has knowledge of all these simple but very important terms will therefore avoid performing any trade at this time and hence he/she will have to wait for days for the trend to be completed.
In the avoidance of a false breakout, it would be very wise for the trader to wait for this breakout or trend to simply have a complete formation. This is simply to show what nature/type of trend formation will come up after the false breakout is done/completed. And it would be also wise to trade false breakout with a buildup.
False breakouts are simply market structures formed to trick traders who have no idea on how this market systems works and hence for the newbies once this false breakout is formed, there just run into the market and will therefore have a sudden crash.
Show full trade setup using this pattern for both types of Wedges.( Entry Point, Take Profit, Stop Loss, Breakout)TRADE SETUP FOR RISING WEDGE
From the price chart above, you will notice the presence of an uptrend in the trendlines which indicates bullish and also a rising wedge where trendlines formed touches both the two-up slopes drawn.

[screenshot from tradingview]
Hence, from the point in the price chart where the market breaks from Bearish to bullish simply becomes our entry point for the market, and the take profit which would be set a little above the resistance line and the stop loss will be set a little below the support line. This is therefore practically explained in the screenshot below.
TRADE SETUP FOR FALLING WEDGE
Similarly, as done for the rising trend, it is also done for the falling trend. From the screenshot below, you will notice that the two-down slopes/falling wedge of the chart(trendlines) touches both sides of the slopes. At the breakpoint of the trendlines, this point becomes the entry point of the market, the stop loss will be set below the tips of the wedges and also, the take profit will also be set below the tip of the resistance line.

[screenshot from tradingview]
CONC LUSIONThis week’s lesson has been very productive by the impact it has made. I will say a big thank you to Professor @sanchio08 for this very wonderful lesson.
Hence, it would be very nice and more helpful for a trader that is able to identify the various wedge formation that is present in the price chart of any traded crypto asset. This simply gives the trader an added advantage in his/her trading.
CC:@sachin08