Trading Using Rectangle Pattern - Crypto Academy / S5W4 - Homework Post for @sachin08

Introduction
After we finish college in season 5 week 3, now we have entered Week 4, this time I will participate in Professor @sachin08's homework assignment about Trading Using Rectangle Patterns, OK now I will try to give an answer to this assignment properly.

1. Explain Rectangle Pattern in your own word.
The rectangle is a chart pattern that forms when price is constrained by parallel support and resistance levels.
The rectangle represents the period of contraction or oscillation between an uptrend and a downtrend. The price will test the support and resistance levels several times before exiting the pattern. From there, the price can trend towards a bullish or bearish breakout.
A rectangle is formed when an asset forms two or more comparable tops and two bottoms that have nearly levels we can use two parallel lines to connect the highs and lows. lowest to form a rectangular resistance and support line.
When a bullish trend is formed, demand exceeds supply and a bearish trend occurs when sellers overwhelm buyers in the market. A trading range is formed when bulls and bears stay in place neither moving up nor down.
Sometimes this leads to the formation of a rectangular pattern which can be described as an area of consolidation or a solid area of the trade. Bearish and bullish rectangles are usually considered continuous patterns, but in most cases they act as reversal patterns signaling the completion of a major top or bottom.
2. How to identify Rectangles. Explain with Screenshots.
The formation of the rectangular pattern is a continuation of the trend similar to price consolidation within horizontal support and resistance levels. If the price starts moving towards a rectangular formation during the trend, another breakout move is likely to occur if the price eventually leaves the rectangular formation. This movement can be as large as the height of the rectangle. The box can be bearish or bullish depending on the direction of the trend. Look at the image below to understand the shape of a rectangle.

image source from tradingview.com
Support and resistance are created by adding lines parallel to each other. The support line is created by joining at least two floors. A resistance wire connects two or more peaks.
The rectangular pattern will stand out at the end of the trend. This implies a change in the direction of the trend.
3. Can we use indicators with this pattern to get accurate results? Explain with Screenshots.
my answer is yes, you can use indicators. Because by using indicators we can get accurate and precise results, as we all know that it is very important in trading to apply indicators, therefore leaving indicators in trading is a silly thing, why is that?, because the patterns that are formed on the chart are not all correct, sometimes we can be fooled by false signals, so in my opinion using indicators in trading is a must, of course minimizing losses and losing the assets we have.
As seen in the screenshot below I use the BB (Bollinger Bands) indicator, so by using this indicator we can see the direction of the trend, overbought, oversold, breakout and others.

image source from tradingview.com
fter we looked at the chart above, after a continuous bullish trend occurred, then the price swerved above for a while, when the price started to decline, the Rectangle pattern occurred, then the Bearish trend continued, then I concluded that using indicators with any pattern is very necessary.
4. Explain Rectangle Tops and Rectangle Bottoms in your own words with Screenshots of both patterns.
The Rectangle pattern consists of two parallel trend lines (resistance and support), these are two horizontal lines, but in some cases they can also tilt slightly up or down. The support line is formed by at least two "W"-shaped bottoms; The resistance line is formed by at least two peaks in the shape of the letter "M".
Rectangle Tops
When the price moves the pattern from the bottom up, it's called the top rectangle on the chart. Typically, highs that tend to break through a resistance line or lows that tend to break below a support line are collectively known as false breakouts.
As seen in the screenshot below :

image source from tradingview.com
Rectangle Bottoms
On the Rectangle Bottoms chart the chart occurs differently, the price started moving at the first entry point in the pattern from the bottom up and could end with a breakout.
In both rectangle bottom and rectangle top, volume is also very influential because it can result in an increase or decrease from the entrance to the exit depending on the respective top or bottom rectangle pattern.
As seen in the screenshot below :
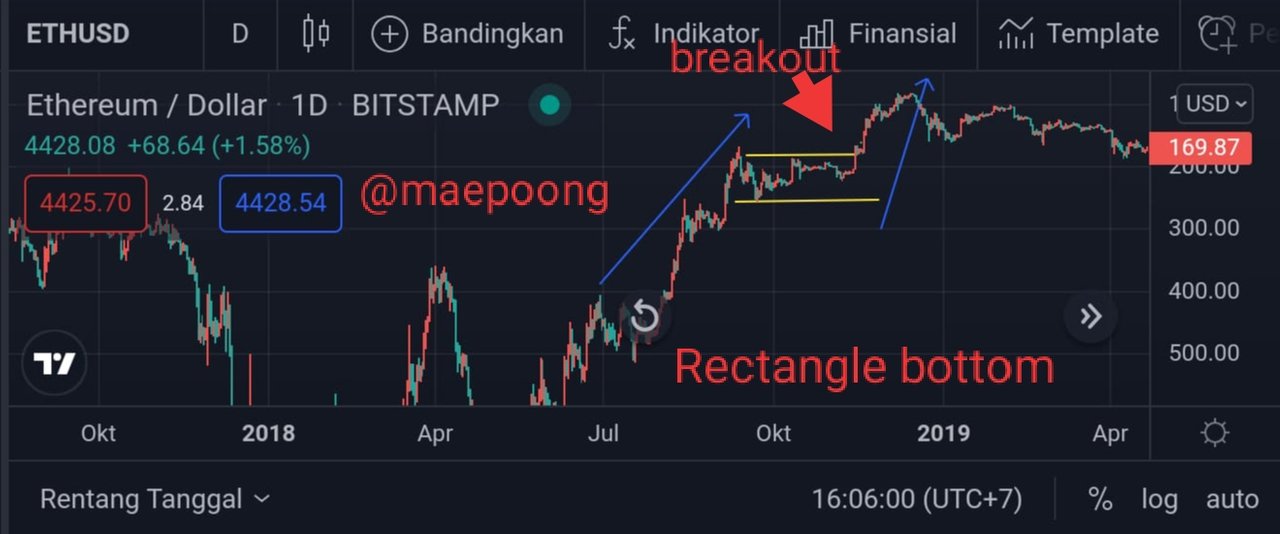
image source from tradingview.com
5. Show full trade setup using this pattern for both trends. ( Entry Point, Take Profit, Stop Loss, Breakout)
We can open a trade when we find a Rectangle pattern whether it's a top or bottom Rectangle as follows:
So how to trade on the top Rectangle pattern with a downward breakout as shown in the screenshot below.
Entry Point : Must be right after the candlestick breaks through the support
Stop-Loss : In the resistance zone of the pattern.
Take-Profit : When the price drops starting from the entry point with a distance equal to the width of the pattern Equal to the distance between resistance and support.

image source from tradingview.com
Then when we trade with the Rectangle bottom pattern with an upward breakout on the chart we can do it as follows :
Entry point : Must be right after the candlestick breaks through the defense.
Stop-Loss : Must be in the support zone of the chart pattern.
Take-Profit : Must be when the price goes up starting from the entry point with a distance equal to the width of the pattern Equal to the distance between resistance and support.

image source from tradingview.com
To succeed in this type of rectangular pattern trading, we have to be accurate in every detail in order to profit, so when the Rectangle pattern appears it is a retest point after the breakout and is a safe entry point for us to open trades and minimize losses.
6. Conclusion
Trading with a rectangular pattern is one of many patterns and this is very important for traders to know because trading with this pattern is very easy to detect trends, whether it is an up or down trend, so the lecture presented by Professor @sachin08 is very useful to all traders, even more so for novice traders.
Thank you very much for reading this review.
Regards @maepoong.