Steemit Crypto Academy Season 3-Week 7 | Trading Crypto With Average Directional Index (ADX) Indicator

Introduction
In the previous parts of our lessons on technical analysis, we have shown what the most important trends, support, and resistance lines are, how to mark trend lines and what they will be for us. We have said that it is beneficial to trade trends because it is easier to estimate where the market will go.
But at the same time, we have shown a situation where the trend is changing. And these situations mainly occur in times when the trend is weak, so in today's work, we will talk about how to know the strength of the trend.
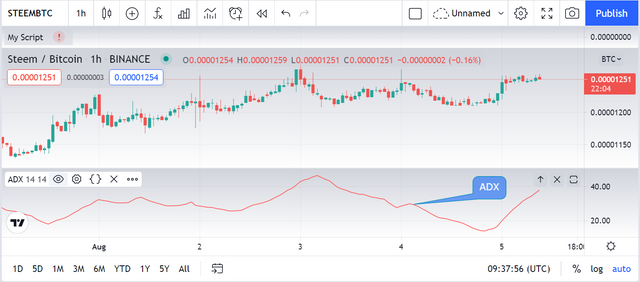
We don't recognize it in the chart as such, but for the sake of simplicity, we use indicators. There is an endless supply, and each was created for a different purpose and is used differently. Therefore, in this article, we will focus on just one, namely the ADX indicator, which has been used in the market since 1978 and is highly regarded by traders for its simplicity and usefulness. In the following image, you can see the ADX as a red curve below the classic candlestick chart.
What is ADX?
The acronym ADX stands for "average directional movement index", which can be translated as "average directional index" and it is exactly what we will focus on today - whether the market is going in any direction, ie a trend. And if so, how strong is this trend.
The indicator ranges from 0 to 100 and is basically very simple to use:
If its value is:
- 0-25: In this case, we know that there is no trend, or it is very weak
- 25-50: There is a trend in the market
- 50-75: The trend is very strong
- 75-100: Extremely strong trend
The most important value for us is 25 because it indicates the boundary between the non-trend market (which is uninteresting for trading) and the trend. Therefore, this level is also indicated by a horizontal line on the indicator.
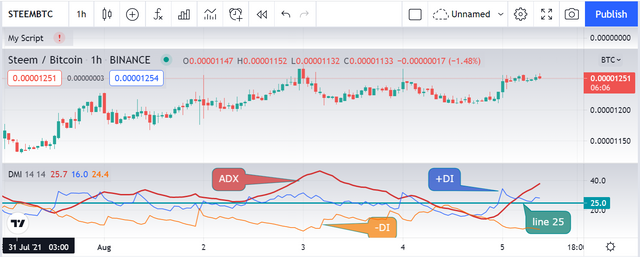
On the STEEM / BTC 1 hour chart below, we've added the ADX. You notice that in addition to the main oscillator, there are two other lines that evolve and intersect at times, this is the DMI (Directional Movement Indicator) which is itself an indicator composed of the + DI or Positive DMI and -DI or negative DMI.
Addition of DI + and DI- curves to the indicator
The ADX can be used without the DMI, but the DMI makes it easier to read the indicator. The DMI shows the direction of the market. How it works is that it measures highs and lows over a period of 14, the ADX's default setting.
As you have noticed, the indicator does not show where the market is going, but only if there is any progress (trend) and its strength. This in itself gives us some information, but not complete. Therefore, the indicator has two more curves, which are called DI + (marked in blue, indicates the strength of the rising trend) and DI- (marked in orange, indicates the strength of the decreasing trend).
So the indicator works by taking the strength of the rising trend (DI +), which adds up the strength of the falling trend (DI-), and the result is the ADX line we imagined at the beginning. However, these two complementary curves are also useful to us because they respond to market movements faster than ADX alone. In the combination of all three lines of the indicator, we get the whole complex of information that we need in trading.
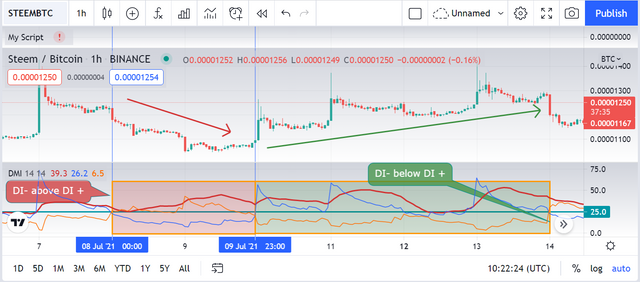
On the same chart of the STEEM / BTC peer above, we have added vertical lines, in order to highlight the phases where the DI + is below or above the DI-. We can see that when the price goes up, the DI + is above the DI-. Conversely, when the price falls, the DI- is found above the DI +.
You may also notice that the ADX increases as their gap increases.
Crossing the DI+ and DI- is not a buy or sell signal
There are some sources online that suggest that DI+ and DI- crosses are trading signals. Following this logic, when DI + crosses DI- on the upside, we have a buy signal, similarly, when DI- crosses DI + on the upside, we have a sell signal.
However, this approach is not very relevant, because the DMI is very sensitive and the DI crosses very often. When you observe them on our last graph, you notice that several false signals are generated using this method.
It is therefore important to use ADX and DMI only to measure the strength of the trend. You can then use other tools for your positions.
Formula or method of calculating the ADX/DMI indicator?
The formulas for calculating the indicator are relatively complicated.
- First, let's determine the DMI + and the DMI- at a time t
Wilder considers bullish pressure to be characterized by two consecutive bullish sessions. Conversely, the bearish pressure is characterized by two consecutive sessions of decline. Thus by measuring the range of price variation between two dates, it is possible to obtain the measure of the buying and selling force.
DMI + = max (0; high of the day - highest standby)
DMI- = max (0; low standby - low of the day)
If over the last 14 periods the prices have only increased, the DMI + will be equal to 100, and DMI- will be equal to 0.
- Then calculate the True Range (TR)
The TR corresponds to the greater value between the high and the low of the day, the high of the day and the close of the day before, the low of the day, and the close of the day before.
TR = MAX (|PH - PB|; |PH - C|; |PB - C|)
C = The price of the day
PB = The lowest price of the day.
PH = The highest price of the day.
- And finally the DI + and DI–
DI + = DMI + divided by value of TR
DI- = DMI- divided by value of TR
ADX:
ADX is a moving average of the Directional Movement Index (DX) using a particular method, Wilder smoothing. It represents the difference between DMI + and DMI- to which an exponential moving average is applied. The ADX is an indicator bounded between 0 and 100. The ADX curve will allow trends to be revealed. Thus, the higher the ADX, the greater the difference between the DMI + and DMI- curves will be. Thus, ADX does not reflect the direction of the trend, but the intensity of the movement.
DX = 100 * ((DI +) - (DI-)) / ((DI +) + (DI-))
Simplifying, ADX corresponds to:
ADX = Sum of n [((DI +) - (DI-)) / ((DI +) + (DI-))] / n
Add and configure the ADX indicator on TradingView :
Create a free account and access the various services.
Click on the Chart tab and choose a pair to trade
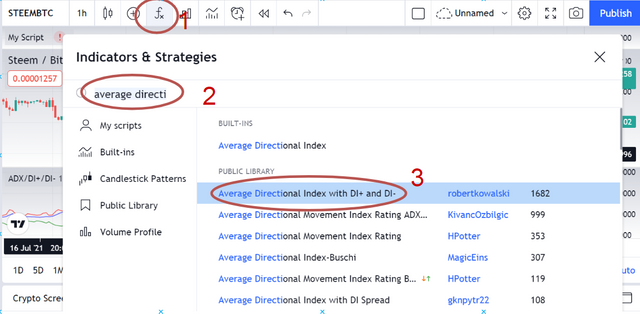
To add the ADX/DI+/DI- indicators:
1- Select the "fx" button
2- You can type the word Average Directional Index or ADX or DMI ... in the search field
3- Then and for my case, I chose "Average Directional Index with DI + and DI-" to use the three lines together.
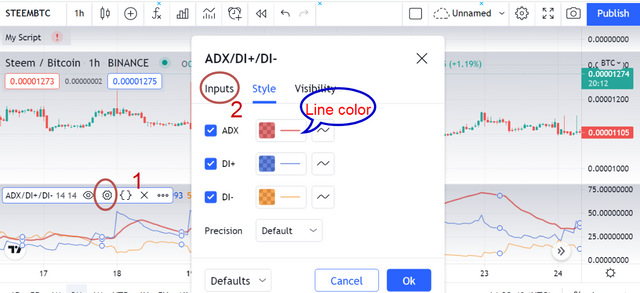
- To configure it:
1-To see the custom window click on the corresponding Settings icon (highlighted with red circle shown in the screenshot below).
2- Then choose "Inputs"
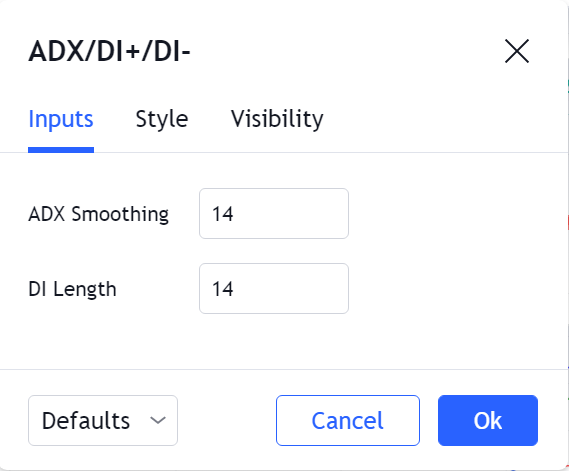
The ADX indicator is read from the last specified number of candles on the chart, for example, if the indicator settings are set to 9, it will focus on the last 9 candles on the chart, for the default settings of the ADX indicator are 14 periods, that is, it will focus on the last 14 periods.
It is of course possible to change the default settings to suit your trading style, but before doing this you should know how changing the settings affects the way the indicator works.
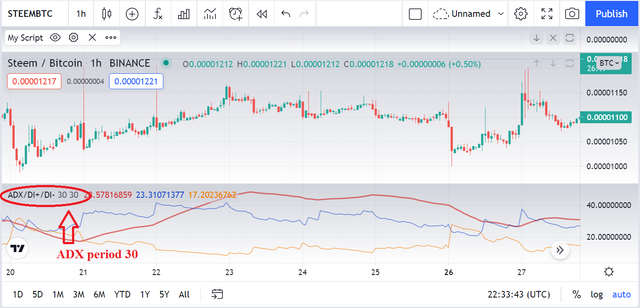
In the previous figure, the settings of the ADX indicator were set to 30 as shown in the left corner at the top of the indicator. When using high counters for the indicator, this facilitates the average price movement shown by the ADX line and the indicator reading is more reliable, but in return, it takes a long time until This reading appears which means that a large part of the trend is missed until you get a good signal.
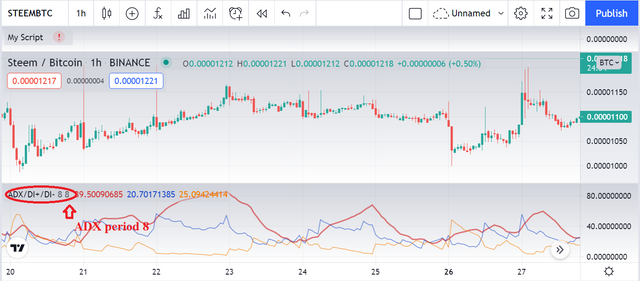
As for using lower settings, it will give the reading quickly, but it may carry with it a lot of wrong signals. Therefore, low settings are less reliable than large settings. Note the following figure for the ADX indicator whose settings are set to 8, and compare it with the previous figure until you get a complete picture of The effect of changing the settings on the way the indicator works.
Using ADX to measure the strength of a trend
- Neutral or weak trend
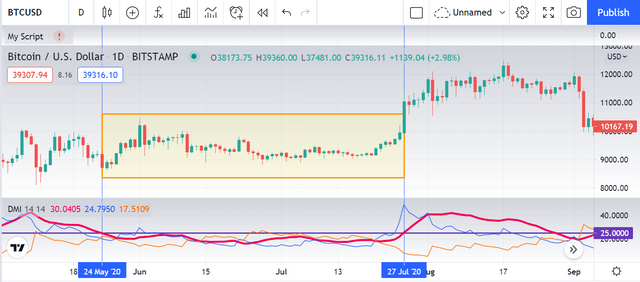
When ADX is in the 0-25 zone, it indicates that the trend is weak, neither buyers nor sellers dominate the market. In these conditions, the supports and the resistances tend to maintain the price which makes rebounds on these. This is therefore the moment when the consolidation chartist figures such as rectangles or triangles are formed.
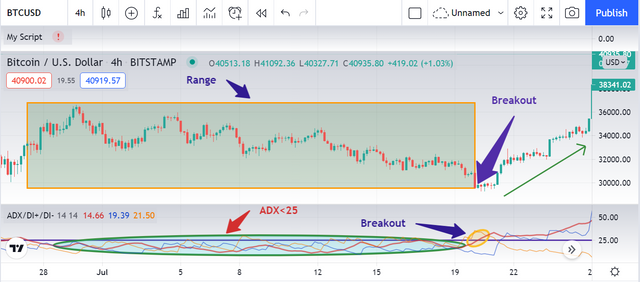
On the chart below, the Bitcoin ADX can be seen plunging below the 25 thresholds between May and July 2020, when market volatility was at its lowest. The price action then entered a very narrow range.
Some analysts consider ADX level 20. In this case, the area representing a weak or neutral trend is between 0 and 20.
When the ADX starts to dip towards the 25-20 level, it indicates that the trend is weakening. In this case, the trend following trading systems might have difficulty. Therefore, it will be good to wait for the ADX to start to rise before applying a trend-following strategy.
- Strong or well-defined trend
When the ADX moves in the 25-50 zone, it means that we can clearly identify a trend in the market. Even if it is not very strong, this trend is quite regular and headed up or down.
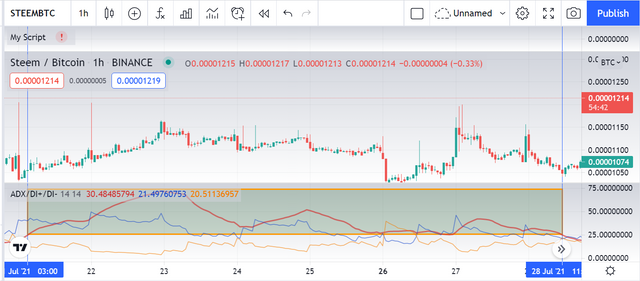
The chart (STEEM / BTC) above shows a fairly strong trend when ADX is above 25.
- Very strong trend
When ADX is in the 50-75 area, the trend is very strong. It is relatively rare for ADX to operate in this area for a long time. Price action easily breaks through support and resistance levels.
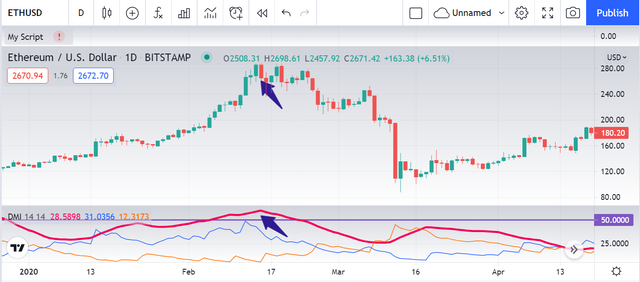
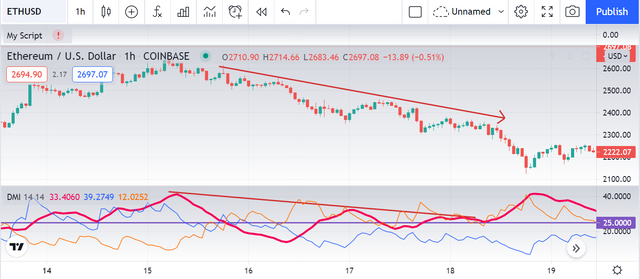
On this Ethereum daily chart, the only time Ethereum's ADX has gone above 50, only to stay there for a long time, was during the cryptocurrency bubble in early 2020. An ADX showing such high values is a testament to the high volatility and the sense of panic among investors ruling the market.
- Extreme volatility
It is very rare to see the ADX rise above 75. But if it does, it indicates extreme volatility following news that shakes the market.
Trading using the ADX indicator and the trend line
When the ADX starts to turn after moving strongly upwards, it signals that the trend is weakening and therefore there may be a potential trend reversal. Whether the trend is bullish or bearish, this approach is still valid.
It is important to note, however, that this may be a momentary break in the trend and not a reversal. It is for this reason that we recommend that you combine this indicator with other tools to confirm a trend change.
The ADX also allows you to determine the strength of the trend without having an exact measurement. Graphically, if the ADX increases, it is assumed that the trend that started will continue.
When the indicator starts to fall, it means that the trend is slowing down and the market can enter a trading range stage even before the ADX drops below 25.
Generally speaking, it can be said that if the ADX is above 25 and going up, the trend is very strong. And if the ADX is above 25, but gradually falls, then the trend is less strong.
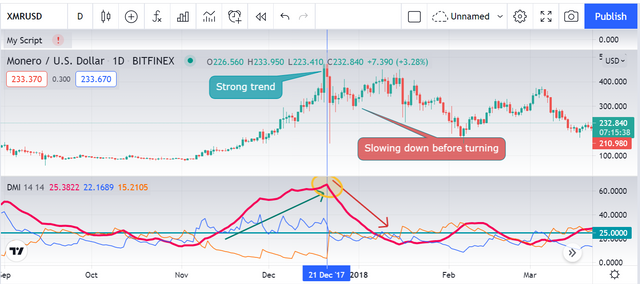
This phenomenon is illustrated in the above chart. Initially, the ADX indicator is rising, which indicates the strength of the trend. When the ADX indicator started declining, the trend was still bullish but weaker. In fact, the price of the XMR/USD pair has stopped making higher highs. The trend turns later in mid-January.
Another way to analyze the strength of the general trend with ADX is by looking at its peaks. The ADX indicator indicating higher and higher highs shows that the overall market trend is strong, even if the indicator drops at times during pullbacks or congestion.
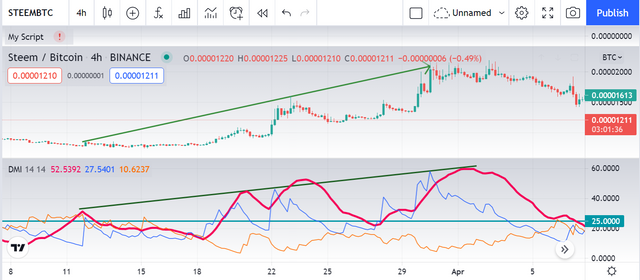
On the STEEM/Bitcoin chart above, we see the ADX scoring higher highs. These are each time followed by retracements of the indicator. Nevertheless, the general trend remains strong and the price is marking higher and higher peaks.
Likewise, an ADX that marks lower and lower highs while the market is trending is a sign that the general market trend is weakening. This happened on the chart above with an ADX scoring lower and lower highs. The downtrend slowed sharply and the market turned around.
It is important to note that such a weakening does not mean that we will have a trend reversal. In addition, we must take into account the peaks that form above level 25.
- To summarize :
Seeing that the ADX is marking higher and higher highs, we can assume that the trend will continue. If the market moves favorably in the direction of your position, you can therefore maintain it longer and avoid exiting your trade prematurely.
On the other hand, when the indicator marks lower and lower highs, one could be more vigilant and be on the lookout for a possible reversal signal to get out of a position that is already profitable.
Use ADX To Confirm Breakouts
Breakouts are common in the markets, but most of them result in a reversal in price that deceives many traders. ADX filters out breakouts that are unlikely to continue in the direction of the new trend.
For example, you can ignore the breakouts that occur when the ADX is below 25. On the other hand, when the breakout is accompanied by a rise in the ADX which goes above 25, the new trend could well. to maintain.
When ADX shows low levels for a long time, it tells us that volatility is low and the market is in range. A rapid rise of 5 points upwards, for example from 20 to 25, is often a sign of a breakout or a continuation of the new trend.
Trading using the ADX indicator for Scalping and Swing trading
- ADX Indicator for Scalping Traders
These methods are among the secrets of the ADX indicator that many do not know. Traders who trade the scalping method can use the ADX indicator, by determining the trend on the time frame they are trading on, and identifying important support and resistance levels.
Many indicators can be used with the ADX indicator for traders who use the scalping method, such as the Average True Range indicator, with the ADX indicator settings set to the period of 100, so that any disturbance in the trend in the market is overlooked, and knowing the trend Prevalent on the time frame you are trading, this method is good on the 1 minute time frame and the 5 minute time frame.
- ADX Indicator For Intraday or Swing Trading
The ADX indicator can also be used for Intraday or Swing Trading, the most important thing is to be disciplined in trading especially when you are a medium-term trader, you have to see the chart clearly, do not use too many indicators on the chart, which will cause blurry vision.
You can use the ADX indicator and add only two indicators beside it, such as the Pivot Points and the Ichimoku indicator, so that you give yourself more certainty on the entry points and the points from which you will supply the quantities of trades, this strategy is used on medium-term time frames, such as the daily time frames, Timeline 4 hours.
- Integrating the ADX indicator with other indicators or technical tools
The ADX indicator contains some defects like other indicators, and it is considered one of the secrets of the ADX indicator that some do not mention, and one of the most prominent of these defects is that it is considered a late indicator in giving entry signals, since it follows the price movement, in addition to that it gives some false signals or It does not contain all the data required to analyze price movements in an integrated manner, so it is preferable to use the ADX indicator with another set of technical analysis tools or indicators that we mentioned earlier in this article.
But these shortcomings are not bad considering the advantages of the ADX indicator, it can determine the strength of the trend in the market, and it gives traders a great opportunity to know who controls the market or the type of trend prevailing in the market, is it bullish or bearish? It is very useful for traders who like to trade Trend Followers on large time frames, so it is a very special indicator.
Advantages and disadvantages of the ADX indicator?
Pros :
- The advantage of this type of indicator is that it can be used as a filter to remove all headlines without a trend.
- ADX is a powerful tool if used with a trend following indicators like Parabolic SAR or RSI.
Cons :
- The ADX indicator is based on moving averages. So it's very slow to respond, in other words, it's a lagging indicator.
- The crossing of DI + and DI- can sometimes occur too frequently, thus giving many false signals.
- The ADX indicator may not provide reliable signals for stocks with low momentum or low volatility.
- Unlike other indicators, ADX cannot be used stand-alone, it should be used with other oscillators or indicators.
Conclusion
ADX is by no means a catalyst that tells you whether to buy or sell an asset. It is simply an indication of the strength of the trend. So it is not a good idea to use bullish or bearish ADX as indicators to buy or sell assets. Alternatively, ADX can be used to make short-term profits by trading in the direction of strong trends. However, you can still lose money even if you are trading in the direction of a strong trend. Stock price changes can happen very quickly, and the ADX cannot trigger a buy or sell signal. He's not looking at a crystal ball and calling the shots to trade. It is just a great way to get the attention of the traders so that they can investigate the stocks that have the potential to make profits. ADX is not a magical tool that can give traders consistent profits. However, it is still a valuable indicator that traders can use to generate short-term profits.

Homework task-5 :
1. Discuss your understanding of the ADX indicator and how it is calculated? Give an example of a calculation. (Screenshot required)
2. How to add ADX, DI+ and DI- indicators to the chart, what are its best settings? And why? (Screenshot required)
3. Do you need to add DI+ and DI- indicators to be able to trade with ADX? How can we take advantage of this indicator? (Screenshot required)
4. What are the different trends detected using the ADX? And how do you filter out the false signals? (Screenshot required)
5. Explain what a breakout is. And How do you use the ADX filter to determine a valid breakout? (Screenshot required)
6. What is the difference between using the ADX indicator for scalping and for swing trading? What do you prefer between them? And why?
7. Conclusion:
Rules :
Try to read the lesson and the assignments carefully before you start editing.
You must write an essay that contains at least 300 words.
Make sure that you post your homework into the SteemitCryptoAcademy community.
Use copyright-free images with mention of its source, if possible, produce your own.
Plagiarism is forbidden in Steemit Crypto Academy, and its perpetrators may face serious penalties.
This homework assignment will run until 14th August'2021, Time- 11:59 PM UTC.
Include in your post among the first five hashtags #kouba-s3week7 and #cryptoacademy.
Users who are powering down will not be voted and considered excluded from participation.
Additionally, users with a reputation below 60 and/or haven't at least 500 SP in their wallet won't benefit from voting for their homework.

Cc:-
@steemitblog
@steemcurator01
@steemcurator02
Hello sir kindly review my homework
https://steemit.com/hive-108451/@monz122/crypto-academy-season-3-week-7-homework-post-for-kouba01-or-trading-crypto-with-average-directional-index-adx-indicator
You are adding the ADX indicator, not RSI. Correct it.
Anyway, Thanks for this wonderful lesson.
Thank you, the name of the indicator has been changed...
Sir please must we use the same calculation type you used or can we use another
You are free to choose any formula, the most important thing is to have a correct calculation, supported by justifying your choice.
Thank you sir
Welcome.
Please, my last work for professor @cryptokraze hasn't been graded. Here's the link below.
https://steemit.com/hive-108451/@uchescrib/crypto-academy-season-3-week-6-homework-post-for-cryptokraze
Hi prof. @kouba01,
You missed to review my homework. It was the last entry, but submitted before the deadline.
Here's the link: Homework Post for @kouba01 | Trading Crypto With Average Directional Index (ADX) Indicator
Time Submitted: 14th August'2021, Time- 11:55 PM UTC.
Thank you!
Buenas noches prof. Si tengo 501de SP pero tengo delegados 210SP puedo realizar la clase de esta semana o los 500sp deben estar disponibles en su totalidad?
Yes you can particpate.
Guao profesor @kouba01 clase Excelente, trataré de dar mi mayor esfuerzo, desde ya preparo mi entrada.
Hi professor @kouba01 here is my class entry https://steemit.com/hive-108451/@mccoy02/steemit-crypto-academy-season-3-week-7-trading-crypto-with-average-directional-index-adx-indicator
Please, Sir, @kouba01, what does the n in this formula represent?
In your case, it s sum 14 periods of DX / 14.
Okay
Hello professor,
I'm having a hard time calculating ADX. Is the following data sufficient to calculate ADX?
DI+ = 0.714
DI- =0.142
Period:14
You can complete the last operations to find the value of ADX indicator in easier way
Calculate Directional Movement Index (DX). It equals the absolute value of +DI14 minus -DI14 divided by the sum of +DI14 and – DI14. It is also expressed in % terms.
Calculate Average directional index (ADX). It is the 14 period moving average of DX.
Thank you very much. A bit complicated. :)