Crypto Academy | Season 3 | Week 7 - Homework Post for @kouba01 | Trading Crypto With Average Directional Index (ADX) Indicator
Hello Everyone,
Indicators help traders to make sound decision when they trade. There are numerous indicators in trading platforms and this week crypto prof. @kouba01 explained the wide range of usage of Average Directional Index (ADX) indicator for crypto trading.

What is ADX indicator and how it is calculated

The Average Directional Index (ADX) introduced to the trading on 1978 by Welles Wilder to measures the trend strength. It was an unique indicator from it's inception because of its ability to reveal how strong the trend is rather than the direction. The indicator can applied to any time frame to determine its strength.

BTC/USDT | 1h | tradingview.com
ADX Indicator indicating the strength of a trend rather than direction
From above figure you can see that regardless of the direction of the market structure, ADX will only indicate its strength of the trend. Because of this exact reason ADX is not a visual comprehensive tool. Instead, we have to understand the levels of the indicator. To measure the strength we have some guidelines as below,
| STRENGTH OF THE TREND | |
|---|---|
| No trend or the current trend is weak | |
| There is a strong trend in the market | |
| Trend is very strong | |
| Extremely strong trend |

BTC/USDT | 1h | tradingview.com
Demonstration of ADX levels
This is the usual set up on ADX, how higher the reading gets that's represent how strong the trend is. Though it ranges to "0 - 100" the strength usually stays between "0-50" range.
When the line in between 0 - 25, we do not consider market as a trending market. The usual patter would be the ranging market. When it crosses over 20 level it could be a signal of a beginning of a trend. When the ADX line moves to 25 - 50 level we can say market is trending. When the line crosses over 40 we can say price is likely to continue the current direction. Above 50 is a very strong trend movement and line will not stay this level for very long period.
We can rarely see that ADX reach above 75 level, if it does it will indicate an extremely strong trend, it can be a upward or downward momentum.
Below are some example to showcase how the ADX value behaved since 2018, most of the time frames for most currencies it was ranged below 50 level.

BTC/USDT | 1h | tradingview.com
How ADX value ranges for BTC/USDT pair

STEEM/BTC| 1h | tradingview.com
How ADX value ranges for STEEM/BTC pair

ETH/USDT| 1h | tradingview.com
How ADX value ranges for ETH/USDT pair
Calculating the ADX
- ADX is Average Directional Index, hence to calculate direction we have to calculate the smallest difference between 02 candlesticks.

Candlestick directional movements
As to the figure (A) we can see that the movement is upward, this scenario we take the difference of current high and previous candle high. Since we only considered high's we call them Plus DM (+DM)
+DM = (High of the current candle - Previous candle high)
As to the figure (B) we can see that the movement is downward, this scenario we take the difference of current low and previous candle low. Since we only considered low's we call them Minus DM (-DM)
-DM = (Low of the current candle - Previous candle low)
The other two figures (C & D) considered as zero DM's since the figure's have zero values.
- Secondly, find the True Range (TR)
The true range has to be the largest from following conditions, It must always be a positive number.
(a.) The difference between current candle high and low,
(b.) The difference between current candle high and previous candle low,
(c.) The difference between current candle low and previous candle low,
So the equation for these 03 scenarios would be,
TR = MAX (| CH-CL |; | CH-PC |; | CL-PC |)
- Next, Find Directional indicator (DI)
Simply divided the values found on previous steps,
+DI = +DM / TR
-DI = -DM / TR
- Next, we have to find the Directional movement Index (DX)
This can be obtained by dividing the difference between +DI and -DI by the sum of +DI and -DI.
DX = [(+DI) - (-DI)] / [(+DI) + (- DI)]
DX value always must be between 0 - 100, If we have decimals we can drop them or multiple by 100 to get the absolute number. When the value of DX is higher the directional movement will be higher while if it is lower the movement will be lower.
- Finally, ADX Calculation
In order to smooth out this movement relative to DX we can simply use moving average of DX or number of periods.
ADX = Sum of n [((+DI ) - (-DI)) / ((+DI ) + (-DI))] / n
- Hypothetical Calculation,
Current High: 28
Current low: 20
Prev. High: 23
Prev. Low: 21
Prev. Close: 22
Number of Period: 10
- Step 01 - Find the values of +DM & -DM
+DM = 28 - 20 = 8
-DM = 23 - 21 = 2
- Step 02 - Find the True Range (TR)
TR = MAX (| CH-CL |; | CH-PC |; | CL-PC |)
TR = (| 28 - 20 |; | 28 - 21 |; | 20 - 22 |;) = (8 ; 7 ; 2)
TR MAX = 8
- Step 03 - Find the Directional Indicator (DI)
+DI = +DM / TR
+DI = 5 / 8
+DI = 0.625
-DI = -DM / TR
-DI = 2 / 8
-DI = 0.25
- Step 04 - Find the Directional movement Index (DX)
DX =[(|+DI−|DI-|)/[(|+DI+|DI-|)
DX = [(|0.625−|0.25|)/[(|0.625+|0.25|)
DX = 0.375 / 0.875
DX = 0.42
Now simply drop the decimals,
DX = 42
Directional movement is somewhat strong.
- Step 05 - Finally, ADX Calculation
ADX = Sum of n [((+DI ) - (-DI)) / ((+DI ) + (-DI))] / n
ADX = 10 [((0.625 ) - (-0.25)) / ((0.625 ) + (-0.25))] / 10
ADX = 2.33
ADX level is between 0 - 25 which mean there is no trend or the trend is weak in this hypothetical calculation.
How to add ADX, DI+ and DI- indicators to the chart, what are its best settings? And why?
Adding an indicator is a very easy prosses in trading view platform, hence I'm going to use the same. The ADX indicator consists of one line, I have used it in previous examples, but the recommended indicator would be Average Directional Index with DI+ and DI- indicator, which consists of two additional lines DI + and DI-.
(01.) First launch this web address: https://www.tradingview.com/
(02.) Next, choose any currency pair you would like to trade,
(03.) Then click "fx" button on the top left corner,
(04.) Type "Average Directional Index" on the pop up window,
(05.) Select "Average Directional Index with DI+ and DI-" by robertkowalski

Adding ADX, DI+ and DI- indicators to the chart
Once the indicator applied to the chart it will appear on the bottom of the chart window.

ADX, DI+ and DI- indicators on the chart
The other two lines, DI+ (green) and DI- (red) lines helps to identify the trend direction. Those can be recognized as Directional Movement Indicators (DMI). The DMI's indicate positive directions from +DI and negative direction from -DI.
Changing the settings in the Indicator
As to your preference settings can be changed for this indicator.
Setting changes to ADX & DI lines,(01.) Hover the mouse to the indicator name and you can see the setting icon right next to eye icon.
(02.) Once you click the button pop up window will appear, under inputs there are default settings which is 14 periods. This number can change as per your choice.
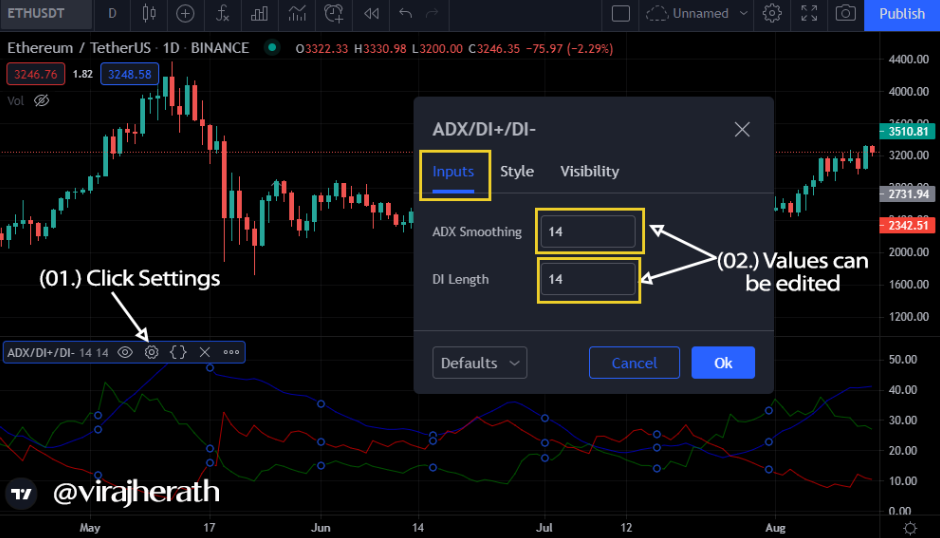
Setting for ADX & DI lines
- Click the styles tab to change the colours of the lines. The default colours are ADX: Blue | DI+: Green | DI-: Red
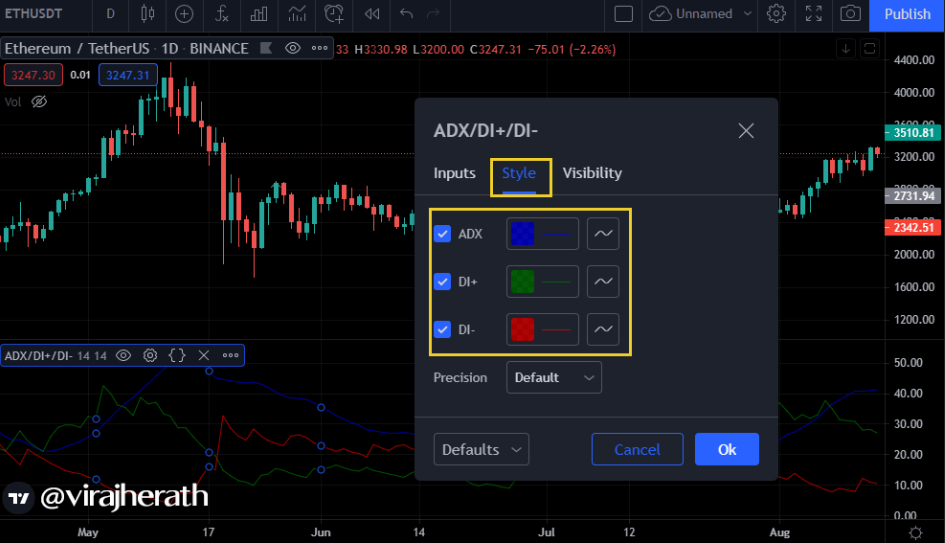
Setting for styles
- Click the visibility tab to change the time allocation for the lines. Recommend to leave as it is.

Setting for visibility
The best settings for the Indicator
The default setting of the indicator is 14 periods. This setting can always change according to the trading strategy. However the Welles Wilder the creator of this indicator must have a reason to use 14 periods. The reason is 14 days considered as half-cycle period. The development of calculation had happened using 14 days of data from the 1978 trading market.
In that case we can not say that 14 periods are the best settings. According to anyone's strategy it could change. However, ADX is a lagging indicator which follows price action. Hence, we can see when we use lower periods, ADX line will react quick to the price changes. This will impact the trading decisions since we can see a lot of cross overs here and there. Percentage wise, it will signal out a higher number of false signals.
In below example I have reduced the number of periods by half to see the difference. It generated 8 cross overs.

ETH/USDT| 1h | tradingview.com
Setting changes to 7 periods
Conversely, when we use higher periods, it will take some time to generate the signals. These signals would be more reliable. However, since it slow to generate the signal we might miss the inception of the trend and join it too late.
In below example I have doubled the number of periods to see the difference. It generated only 3 cross overs.

ETH/USDT| 1h | tradingview.com
Setting changes to 28 periods
Now that we experimented both scenarios, let's see what happen with default settings.

ETH/USDT| 1h | tradingview.com
Setting changes to 14 periods (Default settings)
Well, there I got 5 cross overs, and very convincing strength patterns on ADX line compared to both other settings. I believe 14 periods or something near that number would be the recommended settings for more reliable trend information.
Do you need to add DI+ and DI- indicators to be able to trade with ADX? How can we take advantage of this indicator?
Traders use numerous indicators according to their strategies while some depend on nothing. Indicators provide necessary information to back up our decision on trading. Hence, to answer whether the question "Do you need", yes I would definitely take the help of both indicators for my trading decisions.
Because, DI + and DI- lines, help to identify the trend direction while ADX provide information about the strength of the trend. So, both indicators serve different purposes though they are in the same window. If we use only ADX it will indicate how strong the trend is, but remember it is a lagging indicator hence when we see it, the trend is already started.
Meanwhile, if we use only DI + and DI- lines, it will indicate the direction of the price movements. Price can move up and down even without a trend, best example is the ranging market. This is where the ADX would help, just by understanding how strong the trend is we can take our decisions.
Likewise, understanding the correct signal from both indicators would be the advantage. These are the useful points I see combining these indicators,
(01.) Measuring Trend Strength
(02.) Clear identification of ranging market
(03.) Allows to see the strength of a Bullish and Bearish markets
(04.) Indication of cross overs

BTC/USDT| 4h | tradingview.com
Understanding signals from both indicators (Default settings)
A: DI + has crossed over DI- line in this occasion. This indicates that the buying pressure has increased over selling pressure. In such scenario traders can keep an eye on a trading opportunity.
B: We can see that ADX is over 25 level which indicates a strong trend. That is a good sign for a buying opportunity again.
C: In this occasion ADX cross over 50 mark level to indicate that the trend is extremely strong. Trader might be late for the maximum profit gain but yet he has a chance overlook his buy position.
With this each point we can see how important to have both these indicators in one window. With the help of RSI, we would definitely can go for buy position here. This is how important to have both indicators.
What are the different trends detected using the ADX? And how do you filter out the false signals?
To answer the first question I have discussed the same hence, I would move forward to elaborate on how to filter out the false signals.
We can comparatively reduce the false signals just by increasing the periods of the ADX and D+, D- lines. When both values increase the trading information will be more reliable. I have already proved that on the question title: The best settings for the Indicator with illustration.
Apart from changing the settings to higher value we also can combine other indicators such as RSI or MACD to help to filter out false signals.

BTC/USDT| 4h | tradingview.com
Filter out the false signals
In above market structure, we can see that ADX is over 40 level, we are suppose to see a strong trend but is more on ranging pattern. If we take a buy position just by looking ADX that would be a lose due to ADX suddenly moves downward after few candles. Here RSI value is above 30 and MACD is neutral, when we use such indicators to back up our decisions we can make more sound decisions for our trading without falling to false signals.
Explain what a breakout is. And How do you use the ADX filter to determine a valid breakout?
.
Breakout can occur in both uptrend and downtrend just by passing through the previous resistance or support level. During an uptrend if the precious resistance level is broken by the price action and continues on the same direction, that is considered as the bullish breakout.
Conversely, during a downtrend if the precious support level is broken by the price action and continues on the same direction, that is considered as the bearish breakout.
Such, scenarios are common in any financial market, but with volatility market like crypto this is vey often incident. However, there can be fakeouts where traders falls into a trap due to the traders tend to stop loss around the support and resistance levels. Hence, it is essential to confirm the breakout. Let's see how we can use ADX to figure out the Breakout.

BTC/USDT| 4h | tradingview.com
ADX filter to determine a valid breakout
In above example you can see there is a downtrend and it broke the previous support level, We can see strong trend value on ADX as well, this indicate that the current downtrend is strong enough to continue its direction further. This will be a sign for a trader to take short position.
What is the difference between using the ADX indicator for scalping and for swing trading? What do you prefer between them? And why?
- ADX for scalping
Scalping is a strategy used in shorter time frames such as 1min, 3mins , 5mins or 15mins. The main focus is to trade as many as trades in small profit percentage. This style of trading needs fast thinking and decision making to be spot on. Because you don't have the time to analyze much. A single wrong decision can wipe out you daily profit in a minute.
In such fast moving environment understanding the trend strength is a added advantage. Just by looking the trend scalpers can figure out whether they can trust the current trends. Other than that if the value of ADX is less than 20, it will confirm that there is no trend and change the strategies according to ranging market.
- ADX for swing trading
Swing Traders focus on the fluctuations of the price action and take positions. Unlike scalpers they hold there position for a longer period. Hence ADX will give a better understanding of the strength of current trend. Swing traders can change the settings to 30 periods of time to get more accurate assumptions through ADX.
Conclusion
ADX is an indicator which measure the trend strength. Along with two other indicator DI+ & DI- which provide the direction of the trend, ADX is very useful indicator which can used on any time frame. When it used with other indicators such as RSI, MACD, a trader can make sound decision for there trade.
Thank you!
B
Hello @virajherath,
Thank you for participating in the 7th Week Crypto Course in its third season and for your efforts to complete the suggested tasks, you deserve a 7/10 rating, according to the following scale:
My review :
Good content in general, in which you took the topic seriously, and it appears through your correct answers. I noted some observations:
A simplified and understandable explanation of the indicator and its use.
The final operation is ADX = Sum of n [((DI +) - (DI-)) / ((DI +) + (DI-))] / n, So to get the correct ADX result, you need to calculate DX values for at least n periods then smooth the results.
Your answer in the fifth task was not deep also in terms of analysis and illustrative examples.
A short explanation of two ways to trade with ADX indicator, as you confined to stating generalities without going into more details.
Thanks again for your effort, and we look forward to reading your next work.
Sincerely,@kouba01
Thanks for your review.
Nice Homework Post. Always success for you my Friend.
Thank you, hope same for you my friend