Crypto Academy / Season 3 / Week 7- Homework Post for [@kouba01] | Trading Crypto With Average Directional Index (ADX) Indicator
Hello everyone this is Monz from India hope you are doing great . So we are here with our 7th week and I am so very excited to do this home . Our professor @kouba01 is giving us the wonderful lessons one after the other through which personally I learnt many things about trading.
So let's start with our homework
Q1)Discuss your understanding of the ADX indicator and how it is calculated? Give an example of a calculation. (Screenshot required)
ADX stands for Average DirectionaI Index with the help of this one can measure the overall strength whether the trend is bullish or bearish. So in a nutshell we can say that this indicator is an average of expanding price range values.
Developed by Welles Wilder who was a famed technical analyst. He developed it for trading commodity futures.
Average Directional Index is calculated to reflect the contraction or expansion , of a price of the security over a period of time.
Moreover ADX is non directional which means irrespective of the nature of trend ADX will go up or down .
Keeping the point in mind that ADX is not a trend direction indicator but an indicator of trend strength.
The direction of trend increasingly or decreasingly strong , can easily be identified by looking at the slope of Average Directional Index line.

ETH/USDT CHART
In the chart ETH/USDT above you can see an oscillating line below is the Average DirectionaI Index. And with green and purple arrrows I have highlighted the Priceand ADX on the chart.
And here in the above chart irrespective of the price going upward or downward the ADX line moved up and hence proved ADX to be non directional by just indicating strength of trend.
And upward sloping ADX line shows a strengthening trend the the opposite while a downsloping ADX line indicates a weakening trend.
Now let's see the trend strengths and their ADX Values.
| ADX VALUE | TREND STRENGTH |
|---|---|
| 0-25 | Absent or Weak Trend |
| 25-50 | Strong Trend |
| 50-75 | Very Strong Trend |
| 75-100 | Extremely Strong Trend |
Here from the above table we have seen that from border 0-25 market is non or weak trending . Above 25 the different numbers indicate different strength of trends. From 75 - 100 borderline the market trend is very strong.
CALCULATION OF ADX
We need to calculate for positive directional indicator
Which is indicator(+di) and negative directional indicator(-DI) separately before obtaining the result.
Things needed for calculation are
1.High and low data for each period
2.Closing data of each period
One obtains the positive and negative directional movement first:
- For getting the positive directional movement
(+DM)/upmove =current high - previous high
- For getting the negative directional movement (-
DM)/downmove =current low -previous low
To get the true range of the value we have to pick the highest value from the calculations we got which is shown below:
current high-current low=z
current high-price of the day = l
current low-previous close=h
TRUE RANGE-[[Z,L,H]. The biggest number among them is the true range.
positive indicator
(+DI)= +dm / True Range
negative indicator
(-DI)= (-DM))/True range of a given period
For ADX Calculator;
Then we get DX=100 X ((DI +) - (DI-)) / ((DI +) + (DI-)) for a period, we take the average of dx of a certain amount of periods for getting ADX
ADX= Sum of n [((DI +) - (DI-)) / ((DI +) + (DI-))] / n
One can also use exponential weighted moving average, exponential moving average, or adaptive moving average for the calculation.
Let's take an example and perform the task of calculation
current high =58
current low= 49
price of the day=56
previous high=55
previous low =52
Previous close-48
+dm=58-55=3
-dm=49-52=-3
so,+dm-3,-dm=-3
TRUE RANGE
TRUE RANGE-[[Z,L,H]=(58-49),(58-56),(49-48)=(7,2,1)
TRUE RANGE =7(HIGHEST VALUE FROM ABOVE)
+DI=3/7=0.428
-DI=-3/7=-0.428
DX=100 X ((0.428) - (-0.428)) / ((0.428) + (-0.428))=100
TO get DX we use some more ADX , Now we will be checking for 3 PERIODS Whereas other DX ARE 70 AND 40
ADX=Sum of n [((DI +) - (DI-)) / ((DI +) + (DI-))] / n=(100+70+48)/3=72
ADX = 72 ( Which means its a strong trend.)

2.How to add ADX, DI+, and DI- indicators to the chart, what are its best settings? And why? (Screenshot required)
To add the the ADX, DI+, and DI- indicators to the chart, we have to follow the following steps
Visit to tradingview.com
•We will then have to click on the indicator sign fx is the sign as shown in the picture below:

Then we have a drop down box of options which appears on the screen and one has to select directional movement index as we get both the ADX and the (+di ) and (-di) line together by selecting directional movement index.

Screenshot taken from Trading view
Now the indicator looks like the image below

CONFIGURING THE INDICATOR ON TRADINGVIEW.COM
Next to the indicator name there is a setting icon and by clicking on this setting icon one can see the changes we can make on the indicator .
Let's start from the inputs.

Here we can change our periods for both ADX line and (di) lines according to our preferred setting.
One can choose it according to their choice and preferences.
Next comes our style in which we can change the colour to our preference. Below arm showing the image of my style icon . I haven't changed any colour and left the style as it was.

Screenshot taken from Trading view
Now comes the icon of visibility where one can choose the time frame which one wants to see the indicator at . But I will be leaving it as it is shown in the picture below.

Moreover while changing the settings of the indicator we change the period of the indicator and while changing the period of the indicator range of concentration of indicator changes as we all know that the period determines the focus of this indicator . If we set the period at 15, the concentration of the indicator will be at last 15 periods or the candles in the production of result .
In the indicators usage of of higher time frame are preferred by the traders to reduce the the number of wrong signals which takes place in the small periods as we all know that small noises are tend to be picked up by the small periods .
So preferably traders like us looks for longer periods to avoid the wrong signals.
3.Do you need to add DI+ and DI- indicators to be able to trade with ADX? How can we take advantage of this indicator? (Screenshot required)
It is not necessary to add them but using them improve one's decision -making while reading the ADX indicator. The strength of the rising or increasing market is seen by the positive direction of the indicator, whereas the negative or decreasing market can be seen by the negative direction of the indicator . And leading to the reason why most of the time the positive directional indicators are above the the rising market we consider the market to be positive and rising and in case of negative directionaI indicator being above we consider the market to be falling.
The reason why these indicators are good because firstly they are independently working and react faster than the ADX line which is composite being derived from the two and also helps us in knowing whether market trend is falling or rising up.

We can see in the chart above based on the two lines we can get the the trend information. Generally people mistakes while seeing this two lines which is seeing (+di) cross to above and buying and when the (-di) crosses above selling which is generally a very wrong approach .
The gap between the two lines shows the trend strength. We see that wider the gap significant rise in ADX line .
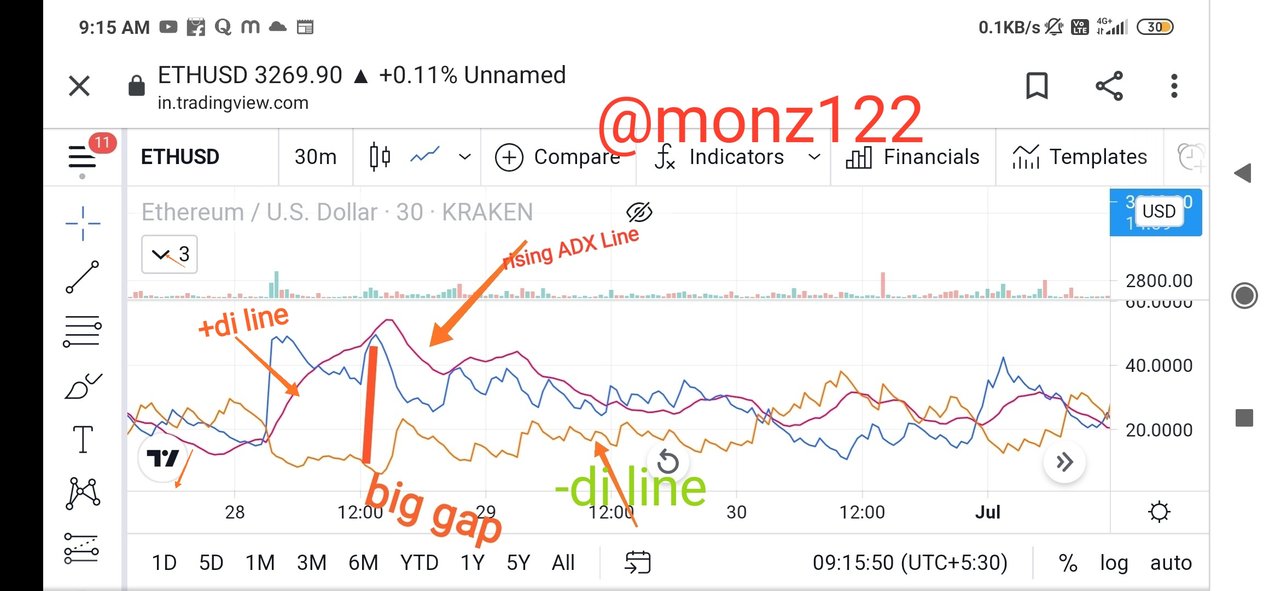
In the above picture of this ETH chart we can see the visible gap between the two lines an its reflection on the ADX lines.
4.What are the different trends detected using the ADX? And how do you filter out the false signals? (Screenshot required)
The different trends detected using the ADX are:
1.Weak trend or Neutral trend
2.Strong trend
3.Very strong trend
4.Extremely strongly trend
Weak or Neutral Trend
This is a low strength trend market where the buyers are equal sellers . The ADX Line in this trend lies between 0- 25 . There exists low volatility in market which in turn gives rise to low strength of market. Your the ADX show weak trends. This type of market wait for the indicator to leave this zones before taking entry in the market.

0-25 market trend or we can consider weak trends market which we can see in the image above
ADX range-25-50 ( STRONG TREND)
ADX line entering from 25 to 50 shows that there is a trend in the market but it does not indicate either an uptrend or downtrend which is not the function of ADX , we can simply consider that a trend exists in the market.

Screenshot taken from tradingview.com
We can clearly see an uptrend here we can see the market going higher high in the image above .
ADX RANGE-50-75 (VERY STRONG TREND)
ADX RANGE 50 - 75 depicts a very strong trend, moving the current market in upward Trend this trend is considered to be a good place to be. Your the train is very strong leading to constant breaks of support and resistance level.
So we can consider this range to be a good range for upward market trends.

Screenshots taken from tradingview.com.
In extremely volatile conditions of market one should not trade if he or she is not a professional traders because of the market news due to some spreaded news in the market.
As we cannot identify the trend whether it will go upward or downward in volatile markets so it is advisable not to trade.
How do you filter out false signals with ADX?
By taking into the account long periods. We know the default setting of ADX takes into account of 14 periods time that can be increased or decreased so keeping in mind ADX time frames at the time when it decreased it becomes more sensitive and the number of false signal in the market increases and when the time frames increases and hence decreases the chance of false signal.
5.Explain what a breakout is. And How do you use the ADX filter to determine a valid breakout? (Screenshot required)
When market breaks through very strong support or levels in the direction of market therefore for a good breakout to occur one needs to see price break out through support and resistance level , moreover a breakout happens in any direction be it upwards or downwards . A high bullish candle represents strong volume of the market which can be a cause of break.

How do you use the ADX filter to determine a valid breakout?
ADX indicator shows the strength of the trend of the market which intern is related to the number of buyers and sellers in the market any Breakout below 25 is indicate big trend of the market but is good to take entry for the new ones in the market.
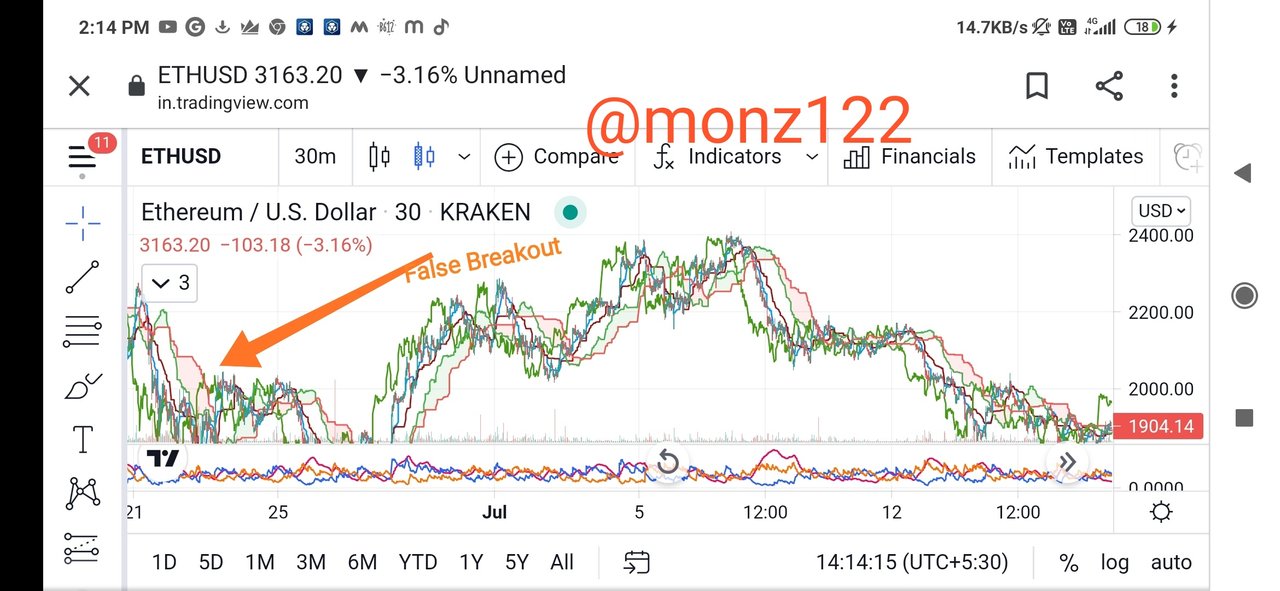
As we take a look into the chart above we saw that ADX would have helped someone avoid a false breakout. The price did not break out but the ADX line was signifying a low strength.

Price breakout when ADX above range 25 which shows sustainable break keeping the price downwards.
6.What is the difference between using the ADX indicator for scalping and swing trading? What do you prefer between them? And why?
| Scalping | swing trades |
|---|---|
| With Scalping we can use any indicator | Only two indicator be added. |
| 1 min or 5 min should be used for scalping | Medium time frame are 1 hour , 4 hour etc. |
| Period is set to 100 for dominant trend | period above 30 should not be set as it's advisable till 30. |
Which one do I will prefer
I will prefer swing trading Because less amount of indicators are needed secondly less number of usage of indicators makes the look of the chart neat and clean due to which one can perform the task easily without being too much messy . Swing trading is comparatively easier and less risky than scalp trading as you can lose money within a fraction of seconds in scalp trading if being careless . The another reason for me choosing of Swing trade is a ADX performs well and perfectly in swing trades .
Conclusion
first of all I would like to thank our professor for giving us such of wonderful lecture and homework which provided a lot of information about ADX Indicator I also came to know the mean and purpose and functions of ADX indicator which I was not knowing so for me this lesson was full of knowledge which I gained.
I also came to know about the trends of market break down and break ups and false breakdown etc. with the help of this lecture which in turn will help me to trade more properly then earlier. I also came to know about the calculations using the ADX indicator. So in a nutshell it was a knowledge giving homework which I completed.
Cc
Hello @monz122,
Thank you for participating in the 7th Week Crypto Course in its third season and for your efforts to complete the suggested tasks, you deserve a 3/10 rating, according to the following scale:
My review :
The selection of indicator period settings depends on the chosen trading system and the type of trader. A higher indicator period is reliable but takes time to give signals, while a lower indicator period generates a quick indicator crossover and sometimes generates unreliable trend information.
Your explanation for detecting false signals wasn't deep, just you gave the general idea without going into details.
A superficial explanation of two methods of trading with ADX indicator, as you confined to stating generalities without going into more details.
Thanks again for your effort, and we look forward to reading your next work.
Sincerely,@kouba01
Download imark from play store for better and clearer indications, it's pretty ok than the photo editor you're using.
Thankyou so much sir for the recommendation I needed one.