Crypto Academy / Season 3 / Week 6 - Homework Post for @cryptokraze

Liquidity Level
The price chart of a crypto asset is made up of zigzag movements which go up and down in real time. These zigzag movements are as a result of the changes in the price of the asset. The price is affected by the great number of people who are involved in buying and selling of the asset.
Trading of crypto assets is initiated when traders make an order to either buy or sell a crypto pair. The buy and sell orders are created to be activated at a certain price level. This level is what is known as The Liquidity Level
The Liquidity Level is a price level where a great number of orders are filled. Apart from buy and sell orders, liquidity levels are also reference points for setting a stop loss.
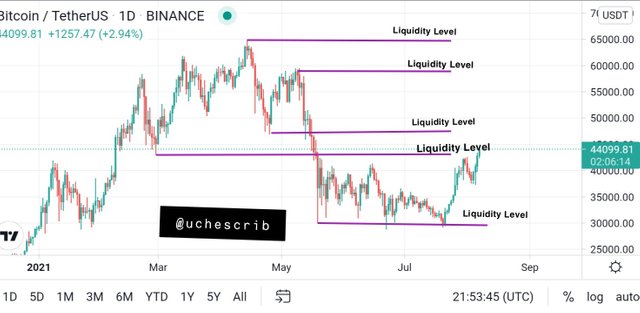
In the image below, the liquidity levels are shown on the daily chart for BTCUSDT pair. It is observed that the liquidity levels are followed by a trend reversal.
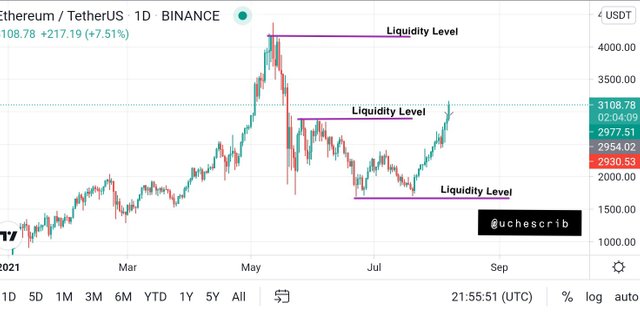
The same thing can also be seen in the ETHUSDT chart below. The liquidity levels are followed by a trend reversal. This is because a great number of orders were filled at those levels.

Fakeouts
In a price chart, support and resistance levels are formed as price moves up and down in a zigzag pattern. Traders watch for breakouts which occur at certain levels, so as to open a position and ride the trend. Breakouts signify a strong trend in either direction.
A fakeout is a situation where a short-lived breakout is formed and is accompanied by a sudden reversal. Fakeouts occur when whales (individuals or organizations with large purchasing power) buy an asset, which creates a breakout in the price chart as the price pumps high. Other traders would see this as a sign of a strong uptrend.
The price would continue to pump till the whales pump volume into the opposite side of the asset pair. This would cause a sudden reversal of the initial pump, leaving other traders that joined the initial points very helpless and hopeless.
A fakeout is created by whales for their own personal profits.
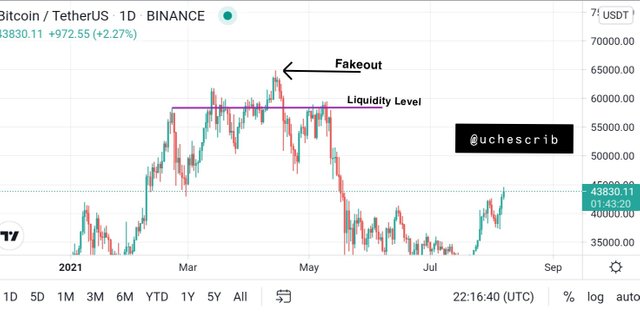
In the BTCUSDT chart below, a fakeout is observed. A liquidity Level was formed and it acted as a support. Whales began to pump volume into the market, causing a breakout. As other traders jumped on the trend, the whales alternated the volume in the market pair, causing a reversal in the trend.
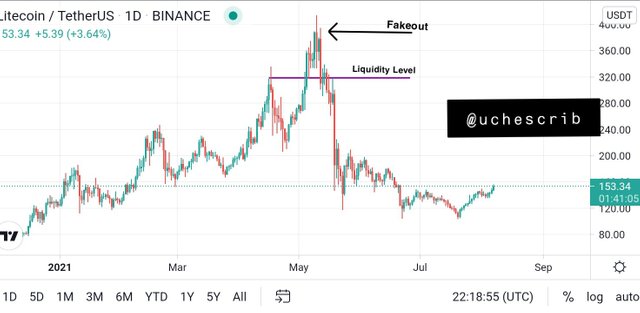
The second example is the LTCUSDT pair. A liquidity level was formed and a breakout occured, causing the price of the asset to rise above the liquidity level because of the massive volume that had been pumped by the whales. Other traders hopped on the trend, causing the price to keep rising. The whales alternated the volume on the other side of the market pair, causing a trend reversal. This action would leave so many traders with huge losses.
How to Trade the Liquidity Levels
The Market Structure Break Strategy
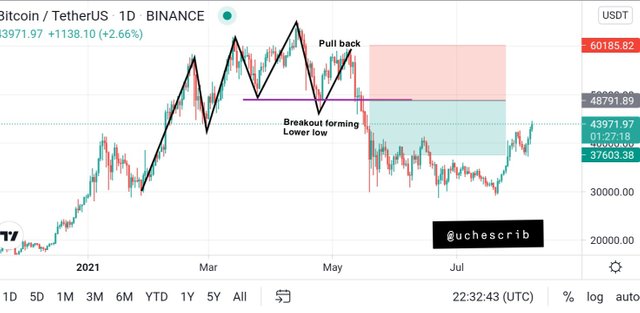
The first way to trade the liquidity levels is by using the Market Structure Break Strategy to trade reversals. For my illustration, I'm using the BTCUSDT pair on the 1-day timeframe.
The uptrend was characterized by higher highs and lower lows. At a point, a lower low was formed. A pull back occured before the price finally broke the liquidity level, forming a downtrend.
Using the MSB would make it possible for the trend reversal to be detected earlier. In this situation, the trader would open a short position at few pips below the last low point, placing the stop loss a few pips above the last high point. In my illustration, I used a risk-reward ratio of 1:1 to set my take profit point.
The Break Retest Break Strategy
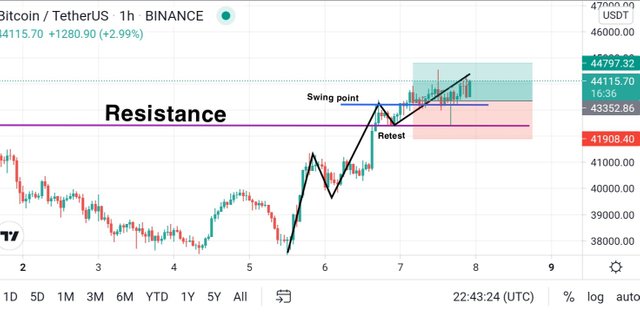
The second way to trade liquidity levels is using the BRB strategy. This strategy is used when trading trend continuation. I'll be using the BTCUSDT chart on the 1-hour timeframe for my illustration.
The uptrend is characterized by zigzag patterns moving upwards. At a point, a breakout from the resistance level occured. A pullback occured which retested the resistance level before price reverted and continued the uptrend.
In this situation, the trader would open a long position a few pips above where the price observed the break out form the last swing point. Stop loss would be set below the resistance and take profit would be set with a risk-reward ratio of 1:1 or whichever the trader prefers.
Liquidity Levels Trade Setups using 1:1 Risk-Reward Ratio
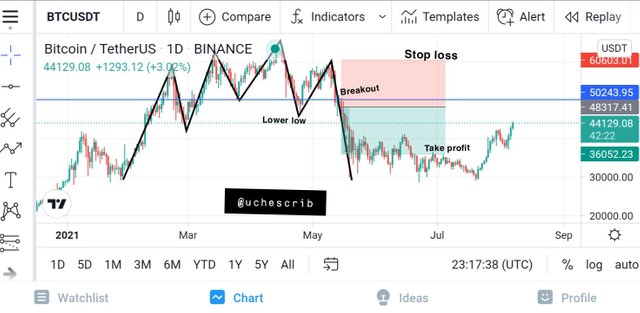
A) The first setup is BTCUSDT chart for a 1-day timeframe. The Market Structure Break Strategy is used for trading the liquidity level in this scenario.
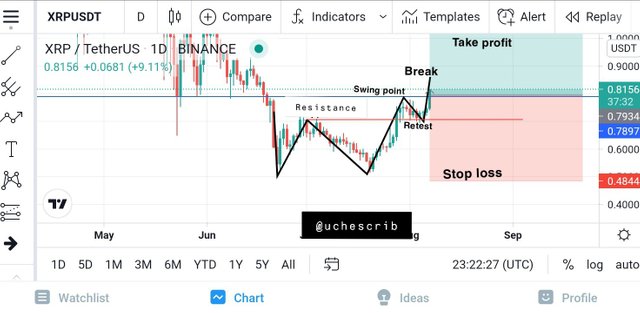
B) This setup is the XRPUSDT chart on a 1-day timeframe. The Break Retest Break Strategy is used in trading the liquidity levels in this scenario.
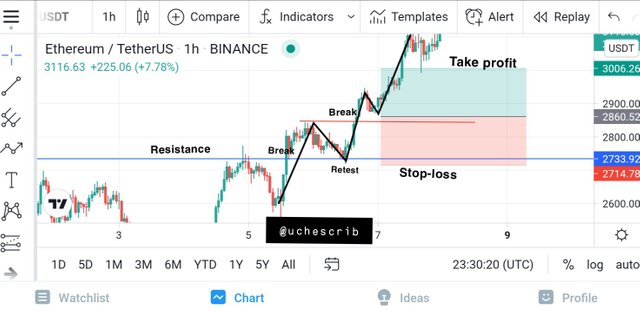
C) This setup is the ETHUSDT chart on a 1-hour timeframe. The Break Retest Break Strategy is used to trade the liquidity levels in this scenario.
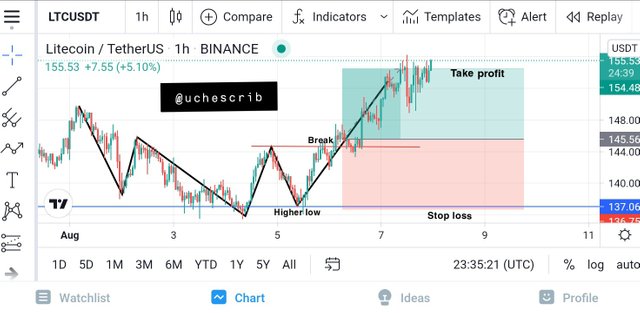
D) This setup is the LTCUSDT chart on a 1-hour timeframe. The Market Structure Break Strategy is used to trade the liquidity levels in this scenario.
Conclusion
Liquidity Levels are price levels or points where orders are filled in the Crypto market. Liquidity Levels can also be created as a result of fakeouts that are created by whales for their own benefits.
Learning to trade liquidity levels would help traders in determining the fakeouts, and obtaining optimal results in trading crypto pairs.
Finally, it is best to use technical indicators like the momentum indicators, to determined when a crypto asset is overbought and oversold. These scenarios are also signals for fakeouts.
Special thanks to @cryptokraze.