Steemit Crypto Academy Season 3-Week 7 Trading Crypto With Average Directional Index (ADX) Indicator
Discuss your understanding of the ADX indicator and how it is calculated? Give an example of a calculation. (Screenshot required)
ADX which stands for the average directional index is a trading oscillator/indicator used by traders to determine trends range movement such as strength and weakness in a trend in general the ADX is used for evaluating the strength of a trend.
On a scale measure, the ADX ranges from 0-100 a measure between 0-20 signals a weak trend, and above 25-50, there is a strong signal in the market while a range from 50-75 indicates a very strong trend if there a range from 75-100 there is extremely very strong trend signal in the market.
This also means the stronger the ADX the stronger the market trends reverse is the case when it is low as well.
Unlike other technical support indicators, ADX is not used for determining bullish/bearish market trends it is used to show the strength in any market trends.
Below is an illustration of an ADX chart
I label box A as the weak ADX range and box B as a strong ADX range it can be observed how the trend followed the ADX pattern reading below 20 shows no sign of trend while reading above 50 shows a strong market trend in a downtrend movement.

The chart below also shows a trend movement in an uptrend move signaling a strong market ADX

How to trade ADX
An important way to trade ADX is by combining it with other indicators which will help in the confirmation of a real market movement.
Traders should wait patiently for a clear breakout before deciding to enter any trade position.
ADX can be used to determine if a trend will continue to range. knowing how range 0-100 works will tell a trader whether the trend will continue or not.
How to calculate ADX
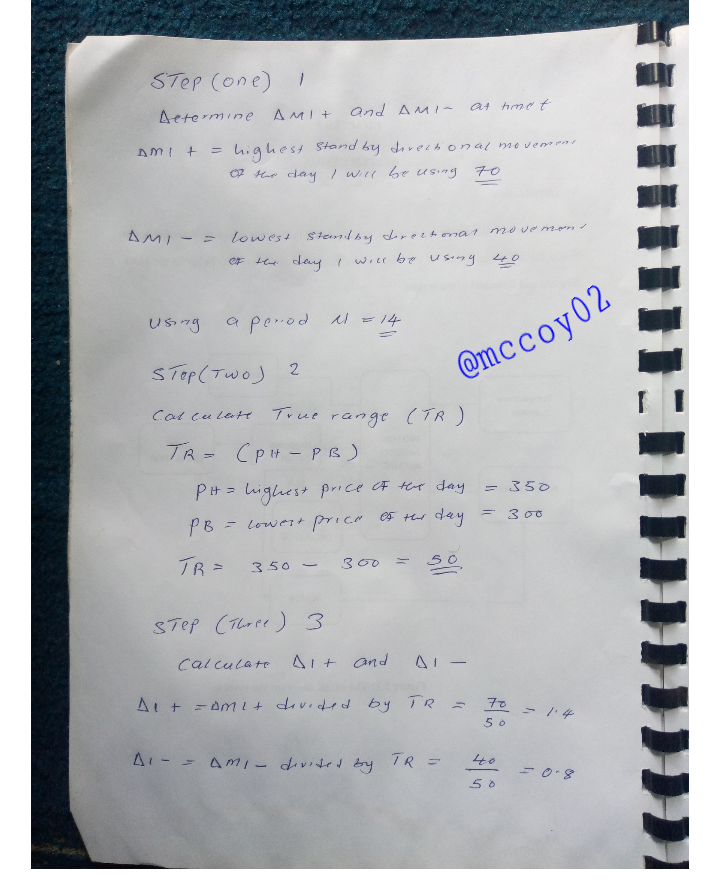

The above calculation shows ADX trend signal is moving in an upward trend for my calculations i used a period of 14 and a price high of 350 and low of 300 the above calculation is based on simulation not real data analysis.
How to add ADX, DI+, and DI- indicators to the chart, what are its best settings? And why? (Screenshot required)
ADX combined with DMI
In other, for traders to work actively with the ADX indicator an additional tools combine to give traders confirmation on a trend can be added which is known as the DMI ( directional movement indicator ) it consists of positive + DI and a negative -DI which are used to show the trend move in either positive (uptrend) or negative (downtrend) both the +DI and -DI combined form the ADX which signals trend strength in the market.

The chart above shows +DI and a -DI all combined with ADX to show strength movement in market trend.
How to add ADX, +DI and, -DI with settings
From my meta4 trading app
Clicking on f icon I will add the average directional movement index

- Average directional movement index

- Below is the ADX default setting

What are ADX best settings and why
For trading choosing, a setting that will suit a trader when trading with ADX will depend on chosen timeframe and strategy
Using a period of 14 is the best setting for trading ADX on the chart and a DI+ above the DI- with the ADX reading above the 25 range. signals a good market strength of an upward movement.
In general, the best setting is the 14-period signal indicator.
Setting with a 14 period or 14 candle reading on the chart gives a trader a more readable view of the market trend movement as higher-period settings can mislead a trader while lower-period settings can provide a trader unreliable trading signal.
Do you need to add DI+ and DI- indicators to be able to trade with ADX? How can we take advantage of this indicator? (Screenshot required)

As stated earlier in the post ADX indicator works best when combined with another trading indicator which means with additional DI+ and DI- indicators the ADX indicator will work fine.
The chart above shows a simple illustration of how DI+ and DI- follows simultaneously with the ADX pattern this trend movement pattern can easily help a trader confirm/filter a real trend movement in the market.
Therefore, depending on a trader's trading strategy they can choose to add the DI+ and DI- indicator, and also they can choose to work with the ADX alone although for more trend confirmation combining both tools will be more suitable.
How to take advantage of the indicator
With the DI+ above DI- in a trend chart a trader will be able to start getting ready for either a strong or weak trend signal in the market.
Both tools combined with the ADX help tell a trader who is dominating the market in either up or downtrend.
Combining the indicators also help traders compare current price movement with the previous
Combining both tools can help in determining ranging movement in marker trends.
DI+ shows the current highest price of the day in a chart and the DI- shows the lowest with both price traders can easily filter out the average directional index movement of a chart trend.
importantly both DI+ and DI- are used to filter trading signal of market trend DI+ above DI- shows or indicates a strong trend move while DI+ below DI- indicates a weak trend move.
Therefore, in general, with both indicators combined in a trading chart, a trader will be able to filter false and true single in the market.
What are the different trends detected using the ADX? And how do you filter out the false signals? (Screenshot required)
Since primarily the ADX indicators are used for showing how strong or weak a trend is they can also be used to detect trends signals different trends can be detected using the ADX indicators, it can be noted that the ADX is a lagging indicator which means it does not predict future price and as well a non-directional indicator that will not a positive figure in price.
Uptrend
In the case of an uptrend/upward trend using an ADX two different trends can be detected which are the strong and the very strong trend.
Here a range above 25 shows the trend is strong while a reading above 50 indicates there is a very strong trend.
The chart below shows a simple illustration of ADX move as can be seen a strong ADX at range 25 and 50 signals a strong and a very strong trend move.

Downtrend
This also depends on the direction of the moving trend when the market is moving in a downward trend a reading above 25 shows the trend is weak while above 50 shows a very weak trend movement.

Neutral trend
The trend signal range for this ADX Is range between 0-25 reading between this range shows no much movement in the market either buyer or seller are not dominating the market trends move.

Explain what a breakout is. And How do you use the ADX filter to determine a valid breakout? (Screenshot required)
Breakout are trends confirmation that tells a trader there will be a continuation in market trend in most cases breakout indicates there is a strong signal continuing.
Using ADX indicator breakout in trading gives a trader affirmation of a trend strength signaling there will be further movement in a trend.

The chart above shows a break-in price movement it can also be seen how the ADX pattern was respecting the trend move the reading below 25 showed a strong trend move as the price keeps moving there was a change in the trend move as the ADX increased from 25-50 signaling a stronger trend here we can see how the market made a quick dump in price as the ADX read above 50 making selling pressure to increase it can also be observed from the breakout there was a strong pull down on the trend movement as the ADX reading increases.
ADX breakout can be filtered from the strength of a trend continuous movement.
If for example a trend continue to range in downside as the ADX scale continue to increase a trader can confirm there have been a breakout in the market trend as shown from the chart above.
What is the difference between using the ADX indicator for scalping and swing trading? What do you prefer between them? And why?
Trading ADX with a swing or scalping strategy will require a trader setting or adjusting his ADX setting period also RSI indicators will be required for trading this will provide the trader with a better confirmation move.
ADX swing trade
Swing trades involved holding a trade position for either short-medium term here a trader can take profit or cut loss when at low-performance gain or loss a trader can hold such position for days or weeks.
Using ADX for trading swing is more profitable as it gives a trader a more clear view of how the trend moves in the market with swing trade trends that are more readable it can easily be used to filter out false trends as this type of period can eliminate false trend movement.
An ADX above 30 on the swing trade can signal a strong trend movement although it will be required for traders to combine the indicator with additional tools like EMA and RSI with strong confirmation that can help a trader take an appropriate trade position.
ADX scalping trade
Scalping involves a trader taking quick trade at a very short time frame like 15 minutes, 5 minutes, or less as has been observed in others to filter or have a good entry on ADX trade a good trend move should be confirmed by using scalping a trader can find it difficult to filter out how trend move due to inappropriate trend move with short time frame this can lead to making wrong position entry on trade.
Therefore swing trade is the best approach for trading ADX.
Conclusion
ADX trading indicators are special tools that can be combined with another trading tool to give traders basic information on how market trends strength are reading ranging from 0-100 would tell a trade how a particular market trend strength is reading below 20 can be in a range of neutral trend while above 25 can be a strong trend above 50 is a very strong trend, the DI+, and DI- can also be combined to help the trader get more info about a market trend.
Hello @mccoy02,
Thank you for participating in the 7th Week Crypto Course in its third season and for your efforts to complete the suggested tasks, you deserve a 5/10 rating, according to the following scale:
My review :
Average work in which you tried to answer the questions in your own way and I have a few points I want to raise:
In general, the selection of indicator settings depends on the chosen trading system and the type of trader. A higher indicator period is reliable but takes time to give signals, while a lower indicator period generates a quick indicator crossover and sometimes generates unreliable trend information.
You just presented how to determinate the different direction of the trend without addressing the role of the indicator in calculating the strength of the trend.
You didn't answer the question :
Thanks again for your effort, and we look forward to reading your next work.
Sincerely,@kouba01
Thanks for the feedback sir correction noted