CHART ART: WEEKEND CRYPTO UPDATE
GOOD MORNING STEEMIT!
Ah the weekend :)
If you remember last weekend, I blogged a reminder to us all that trading is just a facilitator to reach your own personal freedom. I certainly haven't forgotten why I became a trader in the first place and I hope you haven't either.
Right now I'm enjoying just sitting down on the couch, laptop on my lap and coffee by my side as I run through some charts.
Being a forex guy, I still can't get my head around the fact that crypto markets still trade on the weekends. I now fully understand how an oldschool stock market trader feels when we talk about whichever the overnight session is in your time zone.

Tumblr
Welcome to 2017. We live in a global world and nowhere is that more represented than the digital realm. Countries really do not exist once you head online and there is certainly no such thing as a 9-5. Embrace it.
With that in mind, let's take a look at some of the crypto charts.
CHART ART
Coin Telegraph
If you follow me on either Steemit or Twitter then you know I try to add value to the stream by providing my own intraday day trading thoughts on the charts.
I'll start with the higher time frame levels that everyone is posting and looking at, but then drill down to take a look at how price is actually reacting to them. You might be surprised just how technical price trades.
BTC/USD Daily:
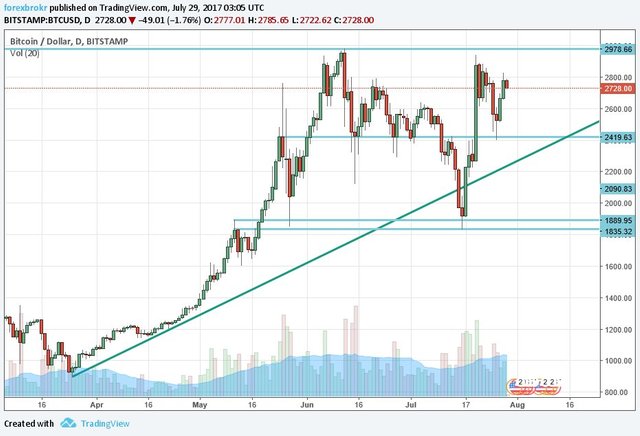
First up we have the Bitcoin daily which actually looks about as bullish as you can get.
Price has held the daily bullish trend line and then retested a previous resistance level as support.
No complaints for holders here!
BTC/USD Hourly:
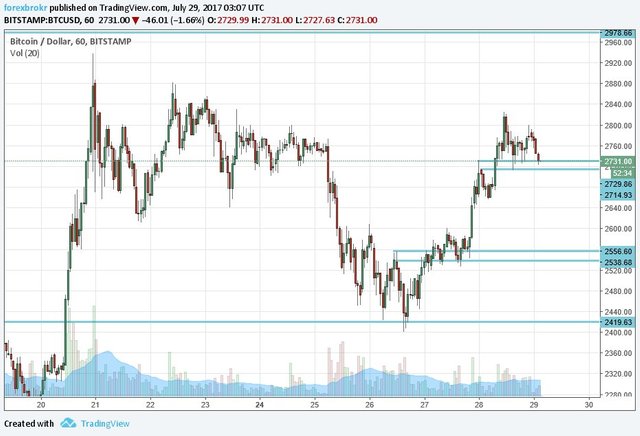
Stepping down to the intraday chart and you can see what I'm talking about when I say 'trading technically'.
After the higher time frame level holds, price has created intraday resistance and then retested it as support where there's an opportunity to buy.
ETH/USD Daily:
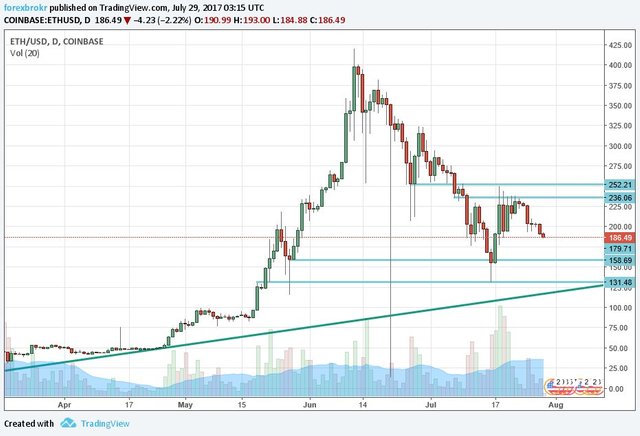
Next up on the WEEKEND CHART ART ticket, we have the Etherium daily which unfortunately doesn't look as bullish as big brother Bitcoin.
I've taken a few liberties in drawing that bullish trend line and made it a little less steep than maybe it should be. But the horizontal levels are still holding and looks as though the important factor is that price is in the midst of a range here.
ETH/USD Hourly:
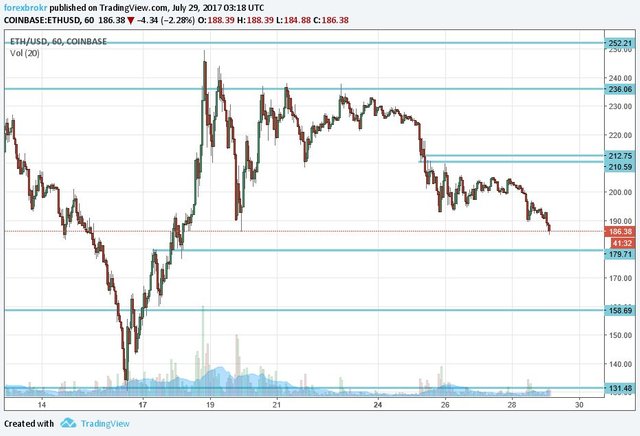
The hourly chart shows us that we're in a bearish short term trend after bouncing off higher time frame range support and the retests of previous support as resistance are pretty clear.
I'm not jumping out of my skin to be buying Etherium just yet.
LTC/USD Daily:
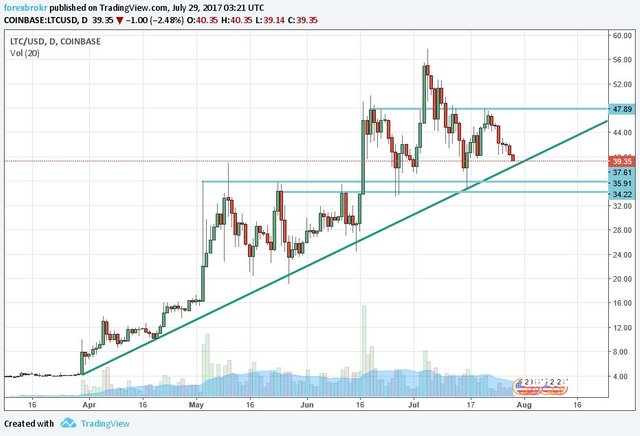
Ah yes, my old friend Litecoin. The little risk-on barometer for Bitcoin that we were all so bullish on as Bitcoin was taking a hit around SegWit.
Price is still above trend line support, but it sure doesn't look as bullish as it once did with that latest down move.
LTC/USD Hourly:
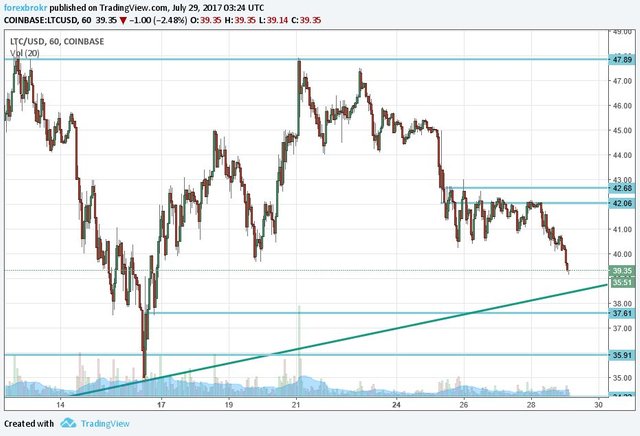
A down move that you can see perfectly on the hourly with a retest of previous short term support as resistance.
Pretty much the same as Etherium here, but the risk-on/risk-off opposition to Bitcoin will throw a spanner in the works.
Wait and see.
STEEM/BTC Daily:
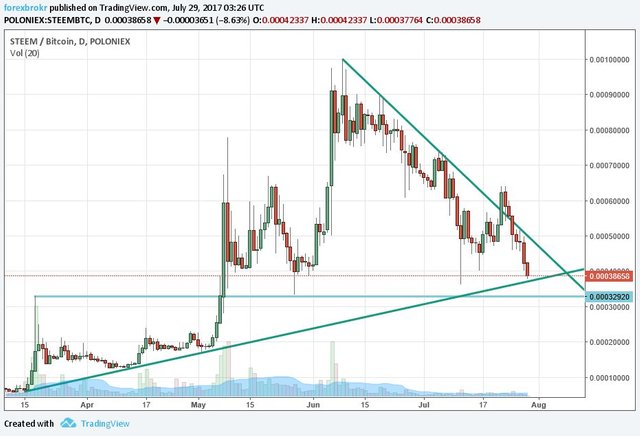
Finally we come to STEEM! It's always a bit strange because of the fact I chart it in terms of BTC rather than USD.
Yuck. Just yuck. I don't want to even go into this one but hey, more support is approaching. Maybe this time it'll hold?
Just a typical bearish trend.
STEEM/BTC Hourly:
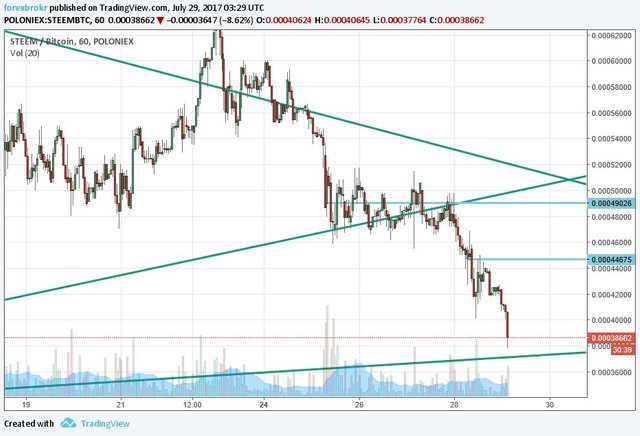
Drilling down into the hourly I have an intraday trend line breakout as well as previous short term support turned resistance.
Again, just yuck.
What are some other altcoins that you recommend taking a look at from a trading point of view? I did Tweet IOT/USD earlier in the week, but it is a relatively new coin without the price action history that I know some of the others have.
Leave a commend and let me know.
Peace!
Related @forexbrokr CHART ART Blogs
CHART ART: EUR/USD Resistance Holds. Time to Short?
If you're not a crypto type of guy, the two forex trades that I've spoken about last week are still in play so click the links above and take a look.
I'm definitely still a forex guy, but when in Rome!
Instagram: @forexbrokr
Website: www.forexbrokr.com

cool i like your content, do you trade on android ? like trade while your on the go?
For short term crypto trading, I have been using Admiral Markets who offer them on MT4 for mobile. Longer term holds I just use CoinSpot via desktop.
That hourly Steem chart looks like an eroded cliff face sad to say.
It's horrible huh...
But like I said, still above daily trend line support and not all is lost yet.
Yuck indeed...
Always fun to examine charts, but when the coins I hold are taking a deep dive, I just turn away and wait 24 hours :)
As long as you pre-planned your position as a longer term investment and aren't just 'turning a bad trade into an investment' then all good :)
Hey @forexbrokr, I actually think that Steem and all other cryptos will see another downtrend the next days. But currently it´s all a little to hot for me to get in as no one really knows what´s going to happen...
Yep, the alts are still in that short term downtrend with plenty of room to still fall.
As an investor, I'm sweating a bit.
It's definitely an interesting time. especially today :) Let's see where it takes us. Maybe you can add some more for cheap money ;)
Great breakdown @forexbrokr. Love the idea of laptop & coffee companionship. I know that setup very well 😊Thank you.
Do your assessments hold in AUD also? I found myself wondering how the USD bear market would be impacting these plots or the conclusions more broadly.
Enjoy your Sunday!
Very good question!
As I'm trading these markets short term on margin, I don't really care what they look like in AUD to be honest. It's just all about a pattern on a certain chart.
However, as a long term holder, I should probably know... but don't.
Super Job on the post @forexbrokr
In regards to LTC, I'm still hoping for a pop up after the 3rd and am thinking that after restesting $38.75 will see it hit $45 again soon (and not $32), I'm all about riding waves but will admit I had more hopes for it in terms of price by now, but with the Bitcoin Cash debacle that kind of through a wrench in the progress of every coin. Still a super time to buy the same coins that you have been buying for quick profit.
I'm just still confused/worried about LTC being an opposing risk barometer for BTC. I want them to both go up, but stil don't know if this can actually happen.