CHART ART: GBP/JPY Ascending Triangle - Is the Beast in for a HUGEEEE Bullish Breakout?
GOOD AFTERNOON STEEMIT!
After @furious-one posted his weekend charts, it gave me a different perspective on GBP/JPY.
I was all about the following higher time frame, daily resistance level:
GBP/JPY Daily:
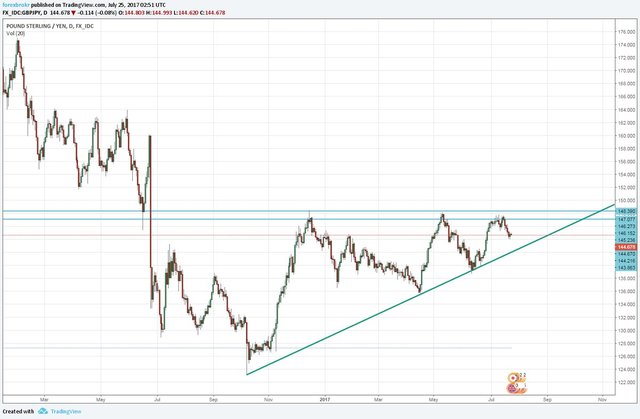
...and as a result was fairly long term bearish. But the series of higher lows make a pretty bloody obvious ascending triangle that is just shouting at us to buy.

Come on, open your eyes!
The best way to trade a breakout of these massive triangles, is to try and get in early in anticipation of a break. As soon as you don't trust the resistance level anymore, it's time to start setting yourself up for the breakout.
I think this way for trading breakouts because when they're this big and this significant, they're not just a hard level that is simply held or broken. They're more of a zone and you can get some serious chop as it shakes weak hands in both directions out pretty easily.
Stepping down to the intraday charts, you can see my classic trading setup where price just steps and steps after a higher time frame support/resistance level has held:
GBP/JPY Hourly:
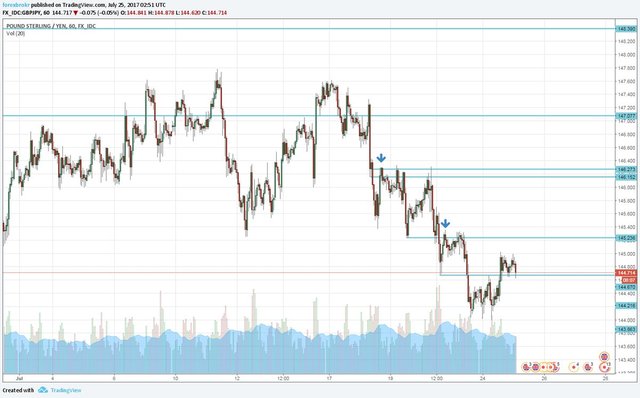
I missed out on the short here, but it looks pretty hot none the less. I had to feature it at least for my own trading journal.
But wait!
Check out where price just happened to stop:
GBP/JPY Hourly 2:
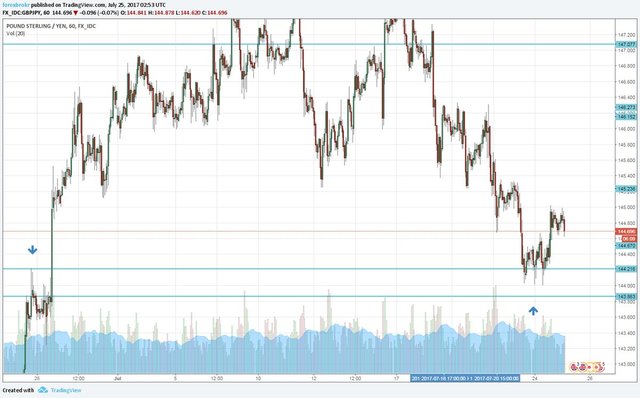
Technical analysis is a beautiful thing, isn't it :) Right at that previous intraday level of indecision!
If you're looking to get an early long in anticipation of the triangle breakout, it's here.

We'll see how this badboy plays out from here, but if that higher time frame resistance level breaks, the beast could be in for one hell of a bullish move!
Peace!
Related @forexbrokr CHART ART Blogs
Instagram: @forexbrokr
Website: www.forexbrokr.com
And it begins. So structured!
Cheers, glad to have your perspective on this
Now lets get that breakout!