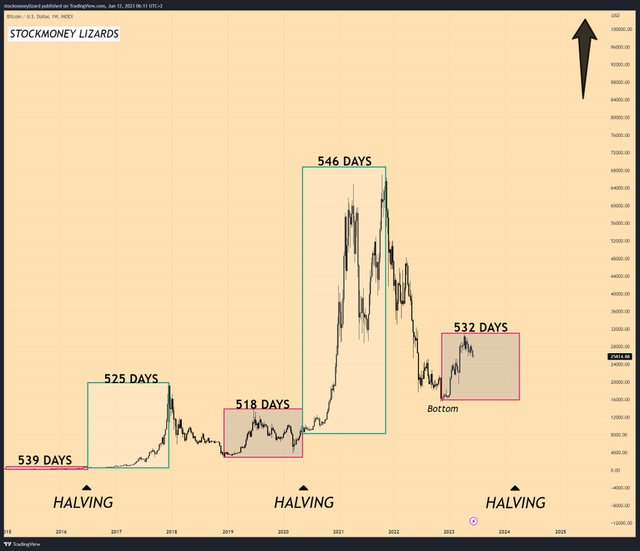
It looks like Bitcoin chart will repeat again due to the Stock-to-Flow model.
The demands of buying or investing BTC have been increasing due to inflation. Dollar value has been decreased during the last 120 years. BTC could be one of the alternative investment assets. As well as, the supply of BTC has been decreasing due to halvings of mining.
So, when it comes to cycles, it looks like BTC chart repeats again and again. Do you think it's just coincidence? I don't think so. I think it's related to the Stock-to-Flow model.
Anyways, it looks like we're in the recovery market. We have 9 months left until the next BTC halving. In the recovery market, BTC has not been recovered much. Patience is needed for long-term investors.
Upvoted! Thank you for supporting witness @jswit.
Your post has been rewarded by the Seven Team.
Support partner witnesses
We are the hope!
i wish hit All time high again, , look like top 69000 was Painted
Hi happycapital loved you content kindly give me an upvote to my because that will motivate me