12/9/2017 The Market View and Trading Outlook

While I at times come off Bearish in my analysis of Bitcoin; that is not my overall take on the technology as a way to generate a return on your investment. My analysis are nothing more than a determination of probable price direction for a given window of time based off technical analysis charts from an unbiased rational point of view. Some here call me a conservative investor, truth be told I somewhat take offense as I’m not conservative per say; I’m just rational and don’t find myself apt to drink the Kool-Aid. I have no problem being aggressive and going all in with a coin providing the technical indicators are there to support the risk I am taking. Now that said, I will never push all in on a single trade; that’s just fucking stupid. On those occasions when I do find myself in it to win it with every penny, it has been done through a series of purchases on the way up. I will buy heavy say 40 percent of my capital at what I feel is the bottom or pull back and add to it as the price goes up, lessening my buys as price increases.
For example I may go 100 LTC, at $100, 40 LTC at $105, 20 LTC @ 115, and then add 10 LTC, 5 LTC etc. till as I see it losing steam. In the event of a biased reversal I still have plenty of cushion to the upside and can get out in the green. Now that said my trading style is not for everyone; but it works for me. As I tend to enjoy lecturing or giving my 2 cents worth of advice prior to analyzing the action each day I will tell you my primary indicators for trading are the MACD at 7/21/77, I also use StochRSI, volume, experience and most importantly caution. For intraday trading I use the hell out of Fibanacci retracement; depending upon volume, momentum etc. I may trade 5 minutes time frames on with 50% Fibanacci as buy points on short pull backs. Which is what I did much of over the last two hours.
I’ll post my trades thus far this A.M. for those that think I’m full of shit. Did I miss the run from $120 to $199 on LTC last night.. yes.. do I care, nope.. I miss opportunities all the time, big deal.. Did fine on the run from $95 to $144 and fine this A.M. from $153 to $173 so far. I’m not saying this to come off like a trading czar, or some holier than thou ass hat; I’m saying to in order to preach patience and to drive home the fact that opportunities to make percentage points happen every single fucking day. Again goes back to the Old Bull and Young Bull on the Hilltop looking down at a group of Heifers. Young bull says to the Old Bull “lets run down there and breed one”, Old Bull looks back and says “Nope, let’s walk down there and breed them all”.
If you have taken the time to invest in yourself and use that knowledge and experience to plan your trades, you will do good; If you are just jumping on a bull market throwing in money simply for the sake that the price is rising, then getting whipsawed into panic selling when you come to the realization that knowledgeable traders were already selling at that point your going to get fucked. Also don’t get discouraged when you do get fucked, it happens; it’s really part of the grooming process to successfully trade. I at one point just considered paying the tuition on my education and goes back to what Warren Buffet says about two people meeting, one with experience and one with money, in the end the one with experience leaves with the money and the one with money leaves with experience.
Ok, lecture and life lesson over for the day,
Onto Bitcoin, well it has been a rather interesting ride this last week, a bloody war of Bulls vs. Bears, leaving a scarred landscape and battlefield littered with casualties and collateral damage. With the introduction of the futures market tomorrow I really have no fucking idea what could happen and it may defy what the charts say should happen. That said what I see now, is fear as the sheep sit huddled in cave waiting for the wolf that is the futures market to appear at its entrance. Price action reflects a bruised market full of hurt, desperation and dismay at the moment. We are in a period of consolidated uncertainty at the moment, Bulls and Hodlers are holding on the chance the futures market will send it to the moon, Bears are slowly selling out to LTC and ETC, and the rest such as myself are just waiting to survey the either blossoming or apocalyptic landscape once it occurs.
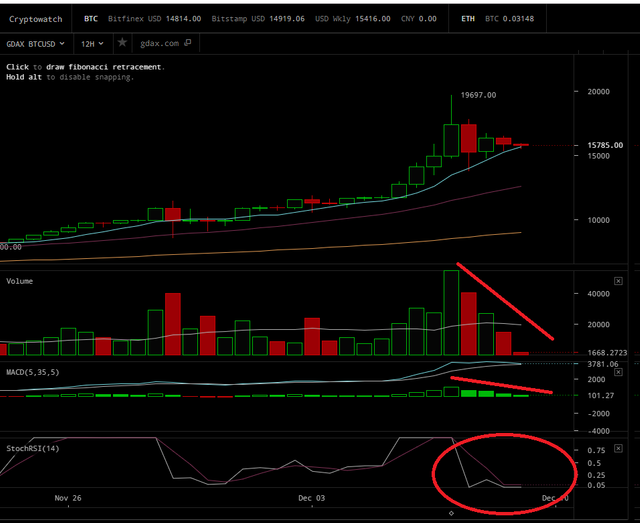
The 12 hour chart,
I have mixed a mixed analysis on this one. Volume is down and trending down which is indicative of lack of interest, but the decline in volume is occurring to the selling side which means that selling is slowing and consolidation is occurring. The MACD puts us trending down into bear territory with a negative MACD/Signal line cross ready to occur very shortly. If this happens expect high volume selling to the downside $13,000 range which may find support and a bounce that may or may not sustain in the $14,000 range. Another possibility, though less likely is we continue trading in range, the lines come close or touch, a balance is established and we jump to the upside; this theory based on the fact that the StochRSI puts us entering the oversold range during this period. Candlesticks during this time frame seem more bearish than bullish, it could be a bearish pennant/flag forming or it could be consolidation to continue the run; too early to tell in this time frame based on this indicator.
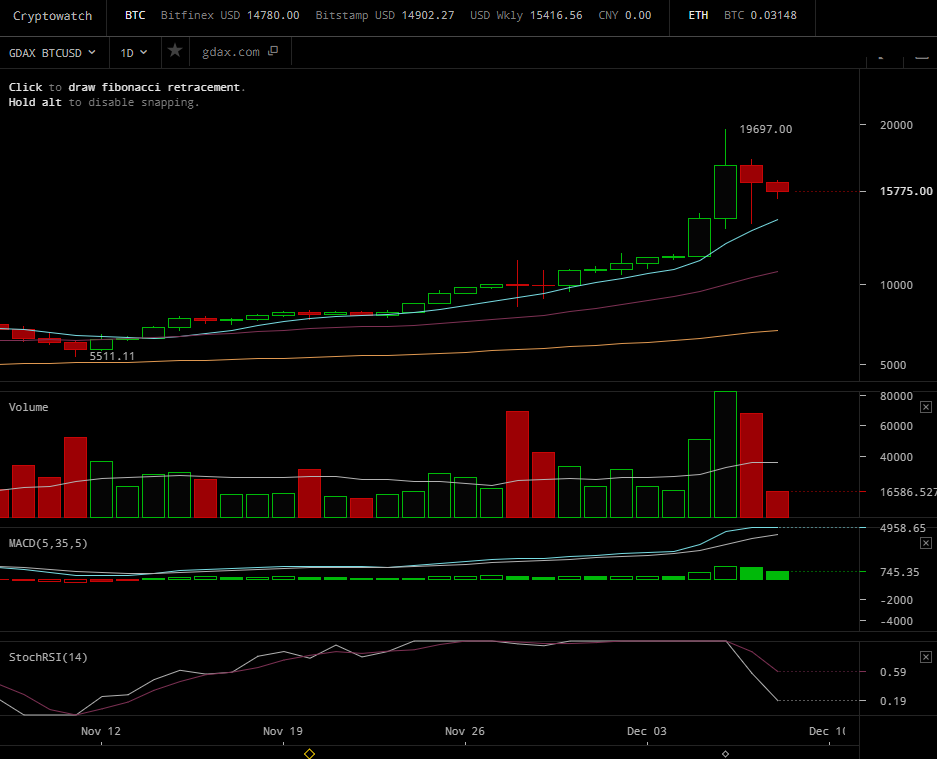
1 day,
The one day puts us heading to the downside; we still have MACD/Signal line divergence to the upside with the MACD Histogram trending toward the downside. Likewise the StochRSI is trending down, as is volume. Most tellingly and the thing that makes me most uncomfortable is how far we are extended above the 77 and 21 day moving averages at $7135 and $10,698 respectively. The last major correction from $7900 to $5000 on 11 November broke through the 21 and bounced off the 77. A similar correction now would be a near 50 percent correction from its current price of $15,600 and a 61 percent correction from the near $20,000 level. My vote Bear around the corner. But the futures market is a wild card as I have no previous data from which to make an opinion.
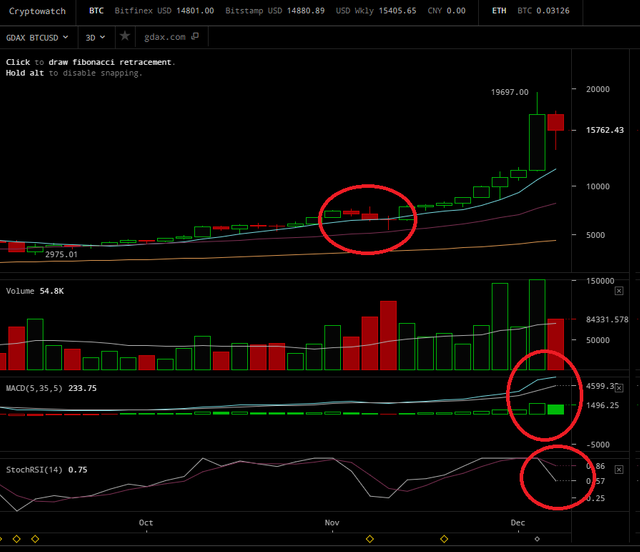
3 Day,
This also puts us heading to the downside based on the same factors mentioned with regards to the MACD, Stoch RSI and the 1 Day chart. In regards to moving averages the last time we touched the 21 period average was during the aforementioned 11 November correction, the time before that 10 September ($5000 to $3000) during the “Great China ICO Ban Scare”. The market being cyclic by nature, it is nearly a certainty that we will have to touch the 21 period moving average which now stands at $8205 at some point. When that will occur, I have no idea, save sooner than later. Keep in mind though that the longer we stay above that price the higher the average will move. That said if the futures market comes in and blows the doors off this thing then my analysis here at this price point may be mute and we will touch it at some point at a later date.
Weekly, no chart but just a brief rundown check it here (https://cryptowat.ch/gdax/btcusd/1w) if you wish. Weekly says to me, there is a high likelihood of extreme misery around the corner. We are telling the same story in regards to the MACD and StochRSI; divergence and overbought respectively. Moving averages also come into play here, the last touch of the 21 period occurred during the 10 September ($5000 to $3000) during the “Great China ICO Ban Scare”. That average currently sits at $6104 which would really hurt a great many people if we touch it. Again the whole future market is a wild card, so I’m FIAT at the moment save intraday trades.

Etherium @ $502
To me, a trade, not a buy.. NO FOMO. I told you to buy at $430, and if you did congrats on your 15 percent profit. That said, 15 percent is not a crazy run up and ETH is not in uncharted territory in regards to price point. It will most likely consolidate or make a further run from here then consolidate for a while and move up based on fundamentals. I could also see ETH being the 3rd string player, first BTC, yesterday LTC and today a run on ETH. Adopting a contrarian view would be the futures market and the inherent volatility of ETH when BTC makes large moves. Trade the ranges, see if you can get $490 or so buys and $500+ sells. I don’t track this chart closely but that is my take on it.
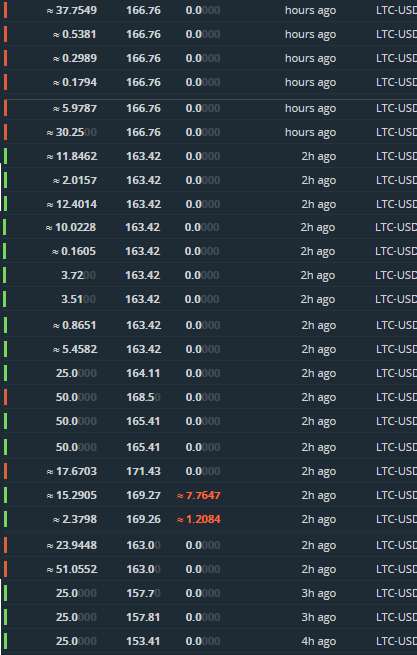
Litecoin @ $168
As with Etherium, a trade, not a buy. It was a buy yesterday, and the day before when I told you to buy it like I did. And if you did congrats on your near 100 percent return. The two hour time frame puts us heading toward a short term correction that may open buy points in the $140 range with future sells above that depending upon volume. We may also get a fake out here in the $160’s wherein the 2 hour appears to be trending toward the bad so as to shake the weak holders, at which point a big buyer will step in and restart the rally. This occurred on the hourly yesterday. If that is the case, based on the erratic buying habits of Coinbase users I could see $250 followed by a drop back to $200 as a support level. Much of what happened in LTC has to do with traders switching teams and using Litcoin as a store of value while the whole BTC thing shakes out. If futures comes in and BTC takes off expect Litecoin to test the low 100’s as they begin emptying this bank account to jump on the BTC train. This to me is a trade and a good one today. Trade the hourly or half hour frames, if you are experienced look for support on the 15 or 21 minutes time frames and trade off those. I would not go to sleep with a large amount of LTC on the books unless I had tight stops as it can be volatile as a direct reflection of BTC price action. My recommendation, look for trades not buys, we are still up 50 percent or more so a radical sell of could occur if BTC goes in the shitter.
LASTY AND MOST IMPORTANTLY;
RESTEEM THIS!!!
I put a considerable amount of effort into making these each morning and hour or more in most cases and I do it to share my knowledge with you so as you can make sound decisions and profit in the market. Pay it forward and Please Resteem.
I apologize for not getting this out earlier, but I started trading at 7 a.m. this morning and it pays much better than STEEMIT.
My trades so far today up over $1000 before breakfast and I stopped so that I could write this article for you guys. With this you can also see my intraday trading style. I try to not market buy or sell at all, but risk management forces me too on occasion.
My previous analysis:
https://steemit.com/bitcoin/@pawsdog/12-8-2017-the-market-view-and-trading-outlook
https://steemit.com/bitcoin/@pawsdog/7whdbh-12-6-2017-the-market-view-and-trading-outlook (Actually 12/7, I goofed the title).
https://steemit.com/bitcoin/@pawsdog/12-6-2017-the-market-view-and-trading-outlook
https://steemit.com/bitcoin/@pawsdog/12-5-2017-the-market-view-and-trading-outlook

Well done man, we have similar approaches, just quick question, are you using Elliot Waves and Pattern recognition techniques?
Honestly, I subscribe to the KISS method (Keep It Simple Stupid). I look at overall market health, volume action, MACD, Stoch RSI, trend etc. I have been most successful with using the 12hr, 1d MACD Histogram as my trend indicator and playing within that. I'm not a HODLER, I trade in and out.. I have looked at Elliot wave but I see the same thing when I look at the 3day MACD and Candlesticks with Fibonacci Retracement. I understand Elliott wave theory 5 up 3 down, but it does not dictate my trading style as I am in and out of positions out of positions in all wave phases. My best friend for intraday is Fibonacci. It's rare that I will go to sleep with Coin in hand unless I'm riding a 4 hour trend and in a solid position as I was with 350 LTC at $95.20 on Thursday night. After years of staring at the charts, you begin to read it and your brain can process all the information on the screen in short order as a total sum of all that is occurring without having to drill down each indicator.. For me reading Candlesticks and Intraday charts are like this:
Thank you for sharing this information. The "full fiat" meme is hilarious! :) have a great day!
Thanks... :)
@pawsdog you deserve to join the TAF guys (Technical Analysis Forces)!!!
Glad to find you here on Steemit.
Check and comment my view in analysis, i wrote.
Upvote this an your previous posts, because you really put a lot of effort in writing them. I folowing you now and I restimed this post also.
See you around, TAF rocks!!!
They should have groups on here that would be neat. Thank you for your kind words. I'm in on the TAF.. I try and write a solid article everyday. On some days I am trying to split attention between writing and actively trading. By definition I would be a high frequency trader so the time I use to write these usually cost me a bit of money.. But I enjoy doing it.. I will read your article...
We can split roles. You can be TAF machine gun, I can take over surveillance and intelligence task!
Die TAF Die hard!!!
Sounds like a plan..