BTCUSD - Technical Analysis October 3, 2017 - Current Price $4287

BTCUSD
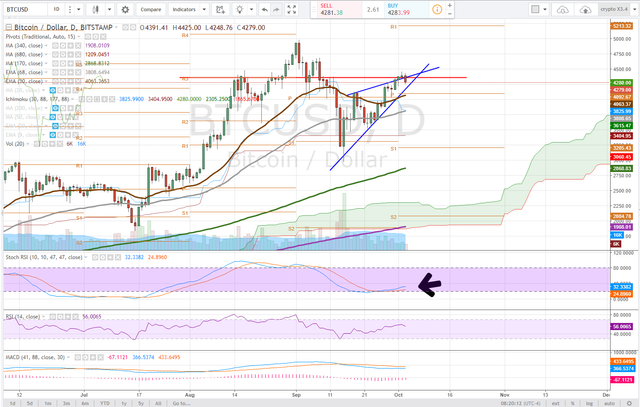
In a previous analysis we made note of the ascending wedge formation bitcoin was currently in and the area of resistance we would have liked to see the price breakthrough.
daily
On the daily time frame, bitcoin ran up and out of the wedge formation and actually managed to close a daily candle above the critical resistance we were watching. The candlestick, however, was a bearish harami and drove the price back down into the wedge formation. It appears very likely we will see a retest of the wedge support.
The ascendning wedge formation is a bearish chart pattern. If the wedge trendline support fails, the line in the sand will be the daily pivot $4085.
4 hour
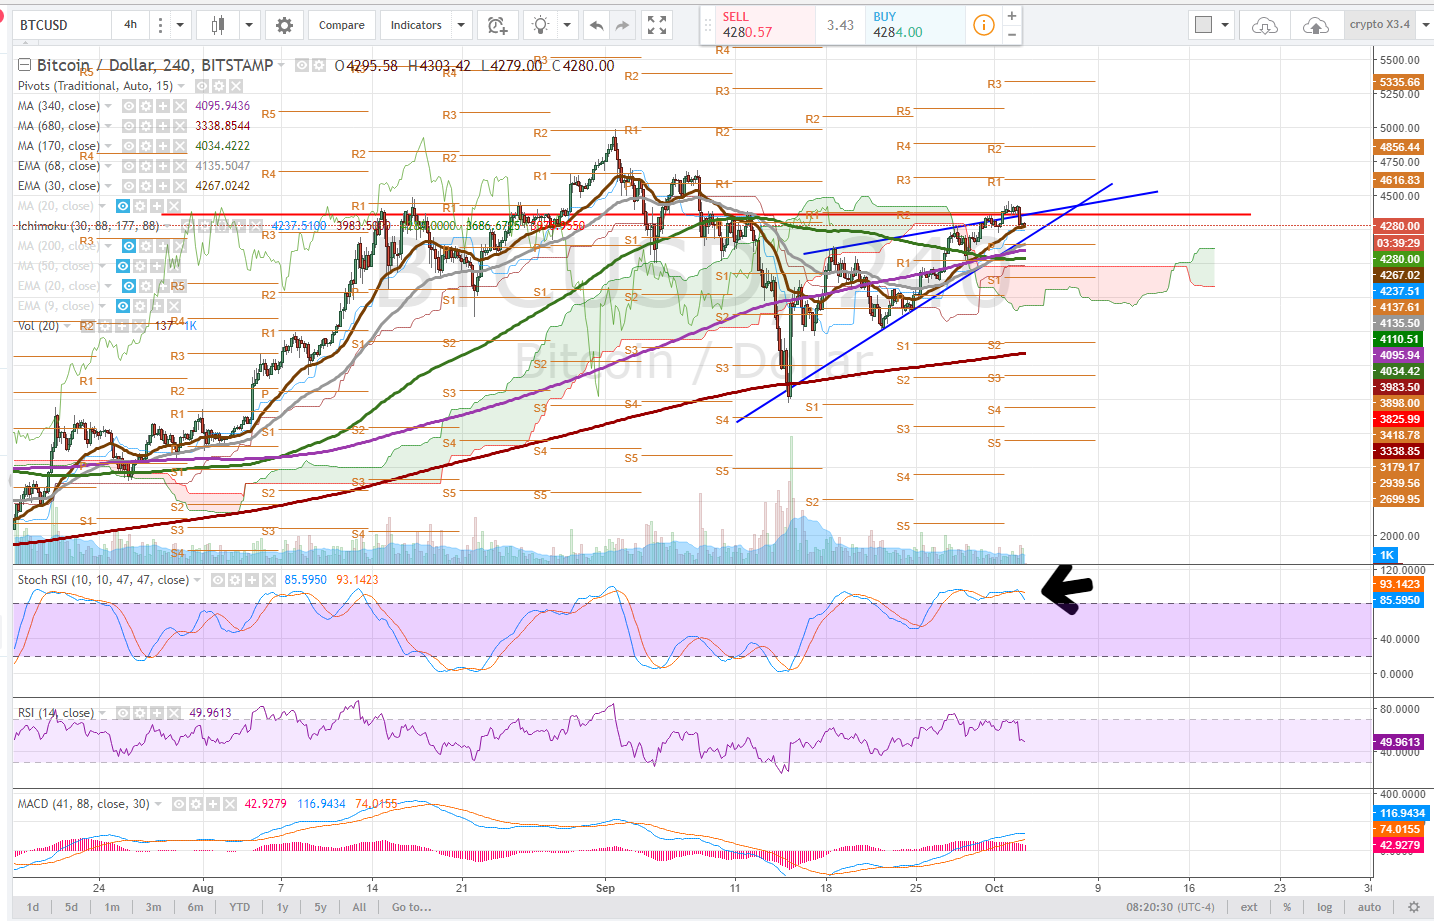
On the 4 hour time frame, notice the extended stochastic RSI as the volume picks up and the price is driving to the downside and currently testing the 30ema as support. Loosing this level on volume will likely start a bearish divergence in the MACD.
Bullish Above: $4460
Bearish Below: $4190 ... very bearish below daily pivot
RISK TRADE: scale into a short position here, maintain a tight stop loss, take profits along the way. Alternatively, wait for a breakout or the daily pivot to hold for a long position.
don't forget to set stop losses!
Previous Articles:
NEOUSD
BCCUSD
LTCUSD
ETHUSD
XMRUSD
Follow at your own risk, Not a financial adviser, understand the risks associated with trading and investing. Manage your own Risk - in other words you could lose it all and it is your own fault


thanks for the analysis and graphics ;)
quite welcome, thank you for your support!
Great analysis! I'll be a dedicated follower :)
Thanks a lot for the support! Just trying to show people some swing trade setups!
YOU NAILED THAT WEDGE!
darn right! look at the 1-hour chart - head and shoulders pattern.
Thanks a lot !
glad if i can help! Im trying to show the pedantic approach to charting!
What is your expectation for BTC on Nov, is it going to reach $5000 or more?
I try not to predict that far, I trade charts only. BTC has to hold the 4k level to make price progression towards 5k.
You are absolutely correct, thanks for your respond to my comment.
Thanks for the perfect post! @satchmo
follow and upvot me for good tips and tricks!, and off course I will follow back if I can learn from you too :)
no thanks, keep your spam.
sry friend, dont meant to do that.
I realy like your posts, thank you for your hard work. I will follow you for more! please if you can take away the negativ upvot.
you should not spam in the future. I will take it away.
thank you very much friend, appreciate that!, that was my first time and will be my last time to! didnt know that that was spaming. Im new here, now I know that.
join free https://bitpetite.com/?aff=cryptojane23