Naked Trading, anatomy of a chart
This post is a kinda response to a conversation I was having with another Steemian that I follow, @andrius1. He made a trade, got it a little wrong and had a small loss. No big deal, but we got into a discussion about it and I said I'd write a post explaining price action trading (no indicators) and how I read a chart.
It's going to be a loooong post, and probably won't be of much interest to anyone except him or people who want to learn price action trading. It's one of those things, if I was doing it in person it would take two minutes, or maybe a 5 minute video, but doing it in text means it's going to be a lot of writing and diagrams, sorry. All I can say is there might be some hidden gems in there, some of which I plan to write about in more detail in the future.
The disclaimer at the start - reading a chart after the fact is very easy to do, it's much harder reading the right edge of the chart in real time. I've written about this before, how easy it is to recognise patterns that don't really exist until you see them in hindsight. A lot of people on here make a living out of doing just that...assholes, giving people false hope when they don't even trade themselves.
What I write and how I read charts is also very subjective. It may be completely wrong but, and it's a big but (no comments !), it works for me ! That's the beauty of reading charts yourself, you can make up any kind of story or reason for explaining what's going on and it doesn't matter. If it makes you money, ie gives you a positive expectancy then it works.
I used to trade what are known as 'liquidity pools'. It's times where the market reaches a state of efficiency, think of it as the price bouncing within a range, because that's what it means. To get my head around it I thought of a chart as being a series of waterfalls, with fish jumping up and down into individual pools of water. One fish would jump up the waterfall to the next pool, and all the other fish would think "hmm, where's he going ? must be some food up there" and then they'd all start to follow. This is the start of a trend.
Eventually, there would be a steady stream of fish all 'following the leader' until the higher pool was now just full of fish all milling around, eating all the food and getting hungry again. This is the ranging / efficient market phase. And then one fish would jump to another pool... Sometimes a fish would jump up and fall back into the same pool, and others would follow it (false breakouts, price tests. You can actually see this on charts, that's exactly what it looks like !
Clearly it's not fish jumping up waterfalls that moves price in the real world, but in my mind it's exactly how I imagined it. And like a scientific theory, my theory made predictions that I could test and act on, and it worked for me.
The point is, it doesn't really matter what story you spin to explain what you see on a chart, it could be entirely wrong. However, if the story has predictive qualities and it makes you money then it's not wrong for you !
Enough of the chatter anyway, this is the way I read my charts. Deep breath, go make a cup of tea before starting...
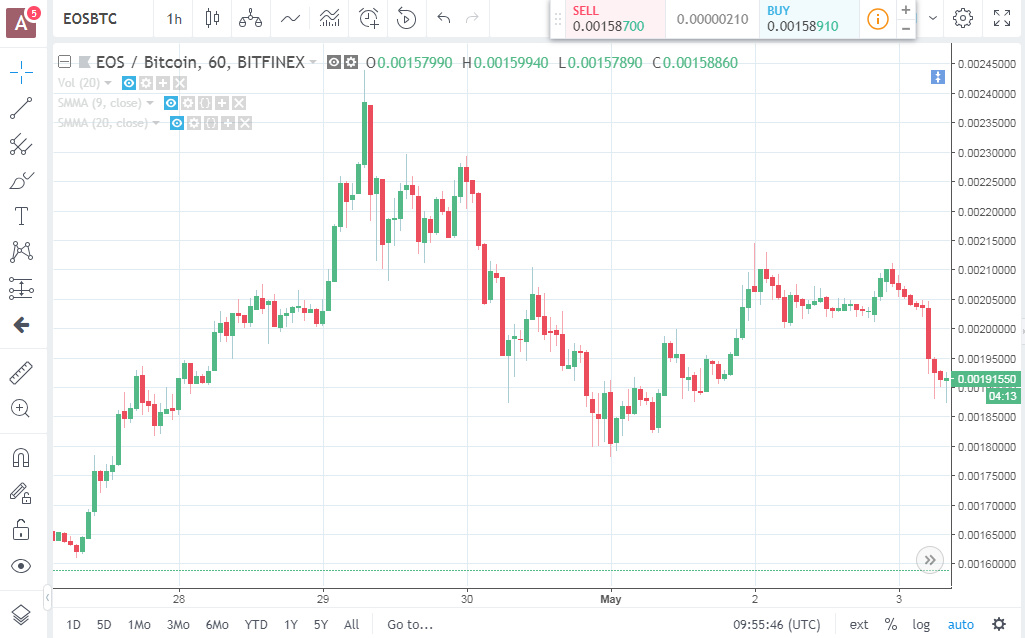
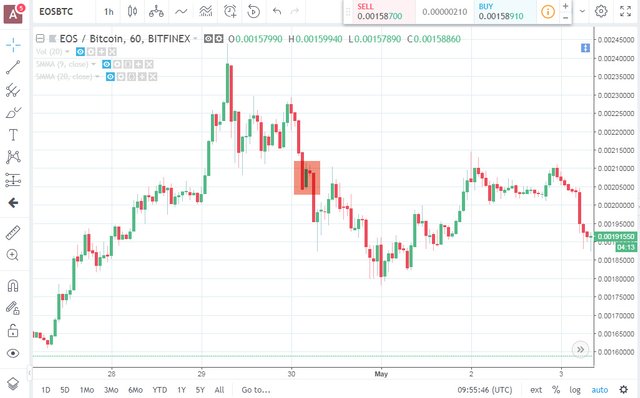
My fellow @andrius1 made a trade on this chart and it was a small loser. To save his blushes I won't point it out, but it was retail traders trade. It probably wasn't a good trade to make from a price action perspective, but this is why I'm writing this.
Try to pretend the right hand side of this chart hasn't formed yet, I could have edited the pictures to remove all the information but I couldn't be bothered, lol, just use your imagination as I go through it :-)
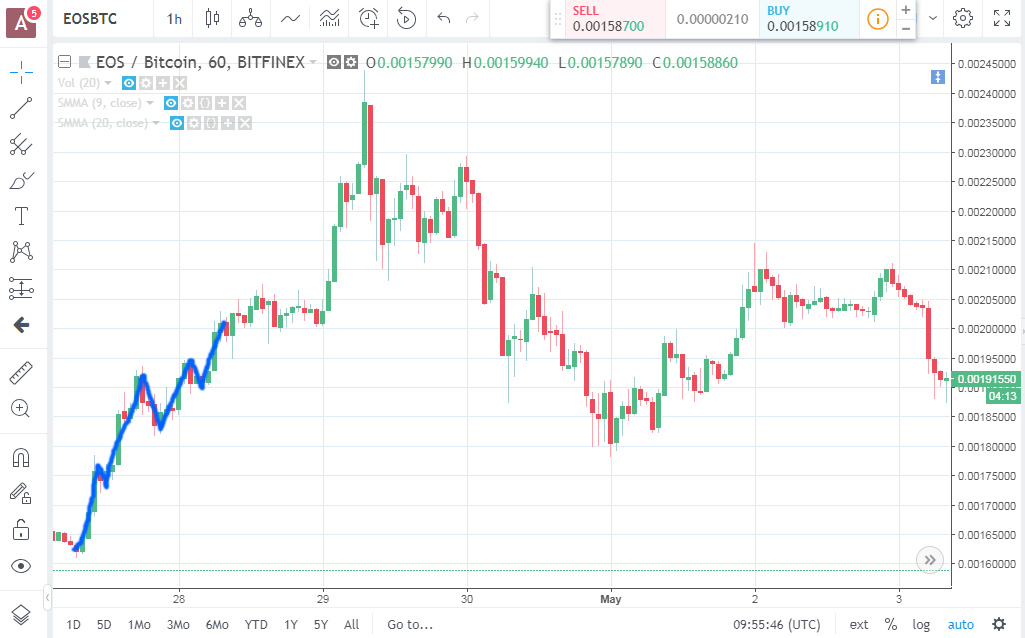
So we start off at the left hand side of the chart (I'll highlight the parts I'm talking about). Normal chart stuff, trending up.
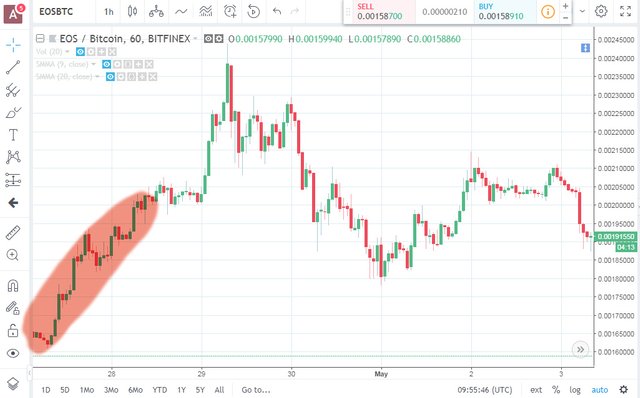
The price follows the same pattern as every other trend, impulse, correction, impulse, correction. It always looks like this, but it's important to recognise the pattern. I probably don't need to spell it out, but higher highs (HH) and higher lows (HL), big candle up followed by smaller candles down, but the overall direction is up.
Then we hit a period of consolidation, a ranging market. Price is lazy and not going anywhere but sideways. The bulls are taking a breather here, maybe pausing before another push up. Or maybe the bulls are exhausted and the bears are going to take over. It's a 50/50 chance either direction at this point, anyone who says otherwise is a charlatan, medium, mind reader or has insider knowledge. "I predict the market has topped and is about to...". Bullshit, you don't know, no-one does.
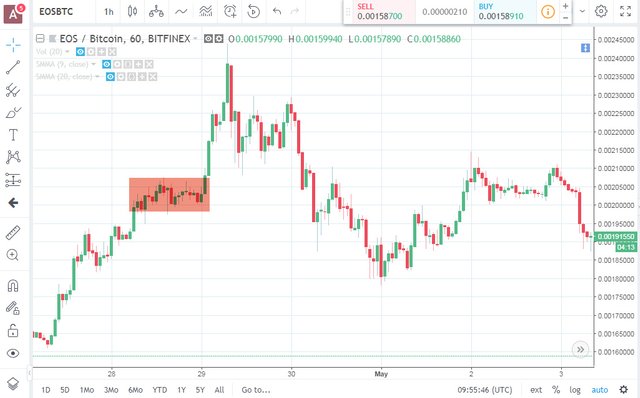
You could put buy and sell orders above or below the range and hope for a breakout, but it's a 50/50 chance of success. But at that point you wouldn't know what's coming so how would you know if the risk of a buy (for example), with a stop loss below the range, would push the price high enough to make a decent risk /reward ? You don't, so you don't trade it. There's no target on the chart so you can't calculate it, don't waste your money. Remember, we trade on probabilities, not just wave a finger in the air and guess.
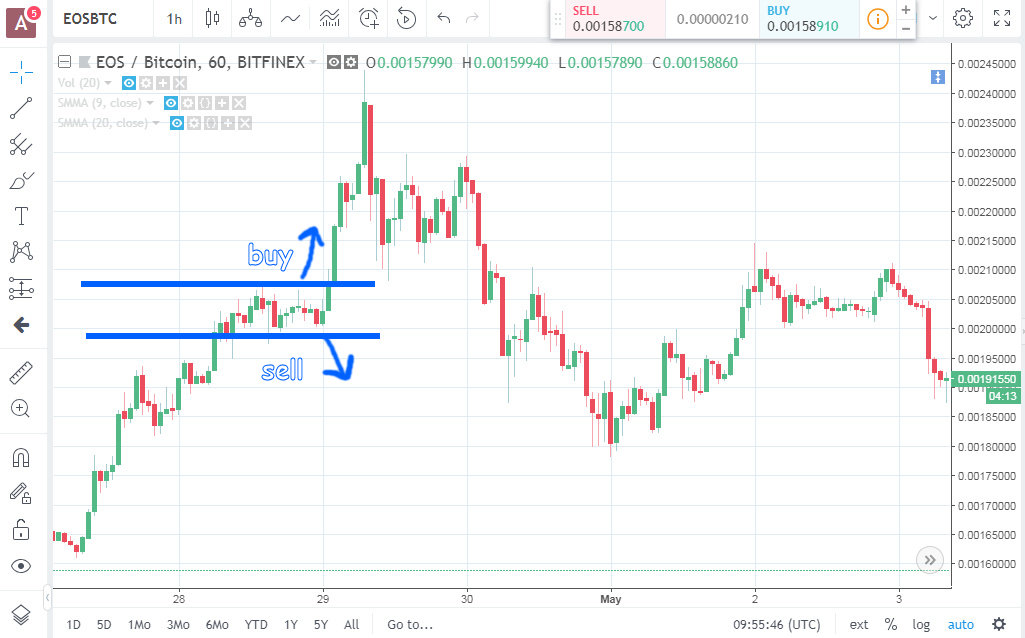
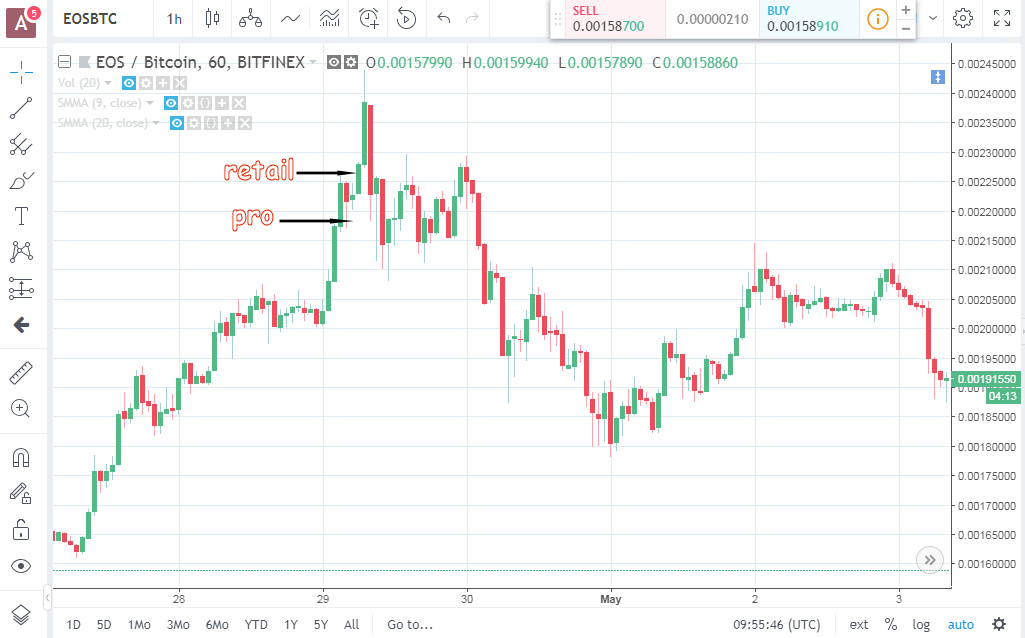
Because of the previous trend direction, it would make more sense to put a buy order above the previous high and hope for a breakout to the upside. Trends always continue in the same direction until they tell you otherwise. But you just don't know at this point, it would be a guess, no trade. It could just as likely be a false breakout that opens your buy order and then plummets straight to your stop loss, that's a retail traders entry (and loss), stay away.
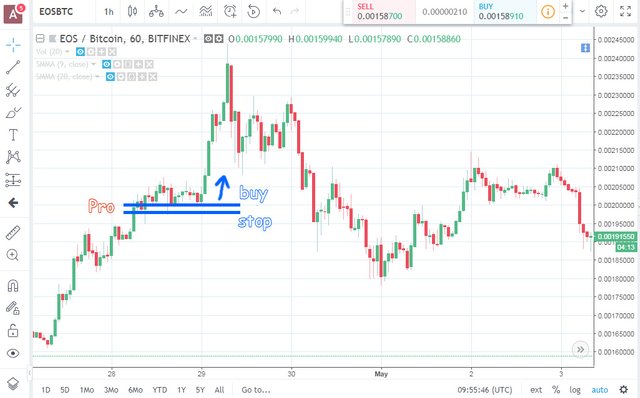
If for some reason you were convinced the trend was going to continue higher, you would have a buy order at the bottom of that range with a tight stop loss. That's a professionals entry.
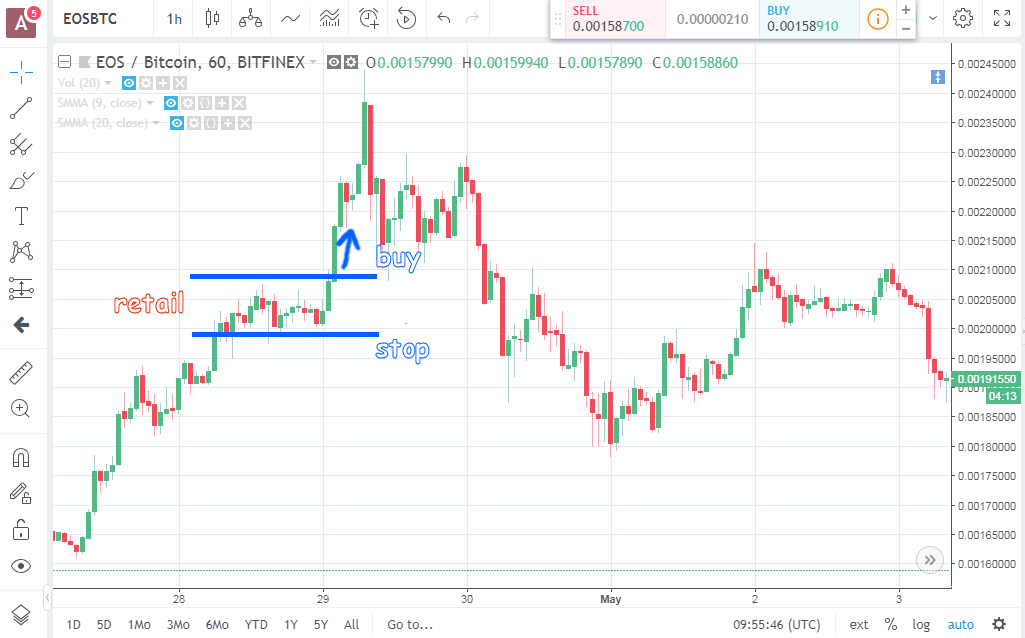
Compare that to a retail traders entry, which would be a breakout above the high. Can you see the big difference in the risk reward levels ?
It doesn't matter, I wouldn't have taken that trade because until that point, there was absolutely nothing telling me the price was going to breakout and rise to the level it did, so I couldn't quantify the risk / reward.
Just something I want to point out though, the retail trader would have made a 1:4 risk reward on that trade, whereas the professional would have made 1:15. Which one do you think is worth the risk ?
On with the story...
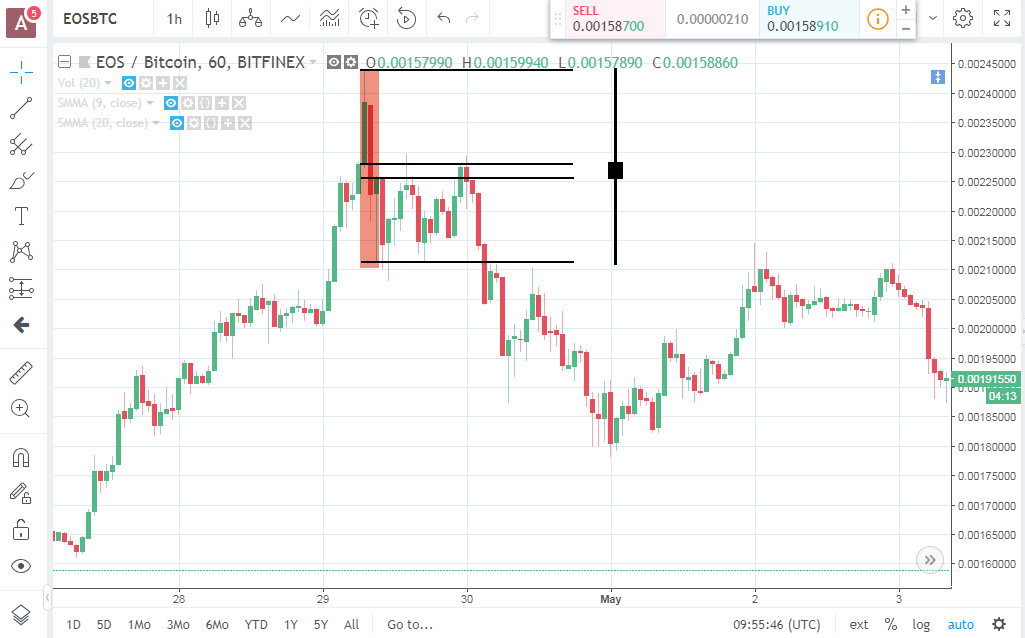
So something happens, don't follow this stock so can't say, probably some news item, air drop or whatever it's called, and there's a sudden interest in it that pushes the price way high.
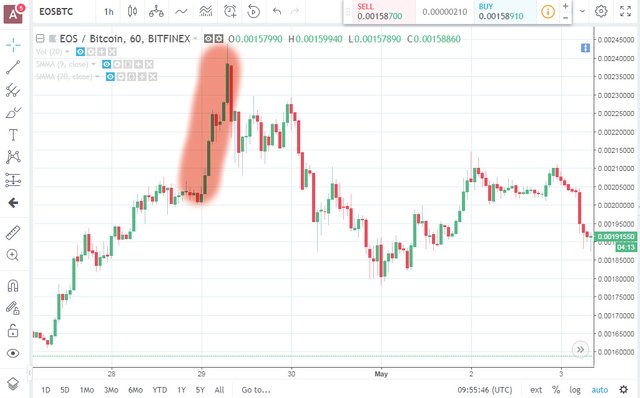
Look at the step in the middle though, there was some hesitation and a slight retrace (impulse > correction). You could have made a pro entry there at the bottom of that red candle, with a stop set only a few points away. That could have made a R:R of about 1:20 or more. Compare that to the retail traders entry, which would have been a break above the high, with the stop in the same place, 1:3 or something.
Don't forget, this is only easy to do in hindsight as I warned at the start, doing it live is another thing. But compare the risk rewards here, if you can make 1:15 risk reward trades then you only need to be right 1/15 times and you'll still make money. To win as a retail trader you need to be winning at least 50% of the time which is an awful lot harder to do.
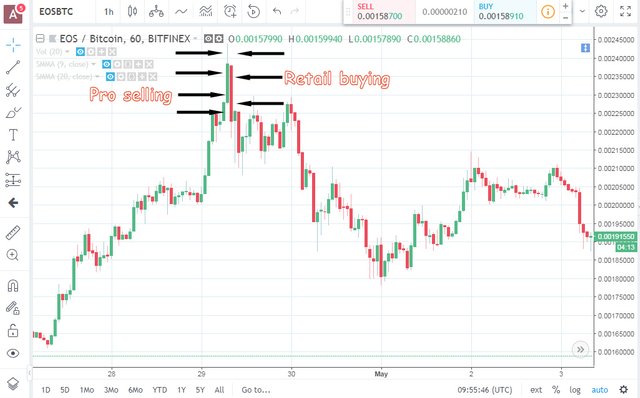
So price then hits a brick wall at the top and there's a sudden sell off. Probably the cleverer people taking profits at this point. A good thing to point out here and it's something I always talk about - for every buyer there's a seller and vice-versa. So when the clever people at the top were selling out and taking profit, who were they selling to ? Someone had to be still buying away up there, and all the way back down as the stock was plummeting. Can you guess who ? Retail traders.
The pros, for whatever reason, had decided that was a nice place to take profits from. And the retail traders who were convinced the market was still 'mooning' were jumping right in and soaking up all those sell orders. Who do you think made money here ?
For the next couple of candles there's huge indecisions in the market. Big wicks all over the place, no-one knows what to do. That's fairly evident when you blend the candles (another article I've been promising to write about). If you see a huge doji at the top of an uptrend it can signal a change in market direction. Just because the 'doji' formed over the course of a few candles instead of one, it still means the same thing. All you're doing is looking at the same chart but on a different timescale. It's a handy skill to learn, looking at higher timeframe charts on the lower, by mentally 'blending' the candles.
After all the fuss has died down, the market falls into a range again.
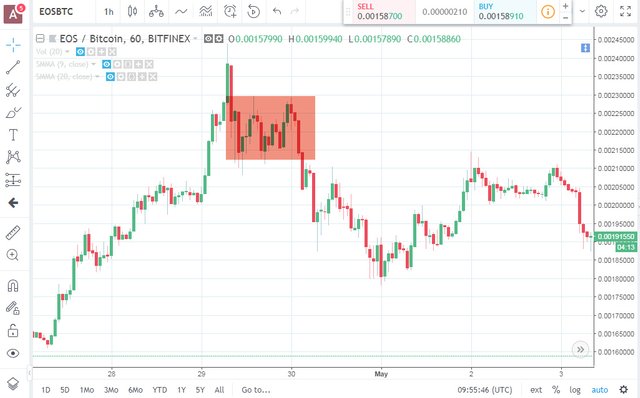
Something to note here, look where support formed at the bottom of the range, it coincides with the 50% retracement level from the first 'upthrust'. It could be coincidence, but 50% retracement levels tend to hold quite well. It could have been possible in advance to draw this support line after the first upthrust formed, and before the market even peaked. It's always worth drawing these lines in the chart. As I said, it could have just been coincidence but these kind of things happen a lot, and anything that pushes the odds in your favour is a good thing.
Even if they only worked 55% of the time, slightly more than average, if you traded off that line then you're adding another 5% chance of success for your trade. Just something to keep in mind.
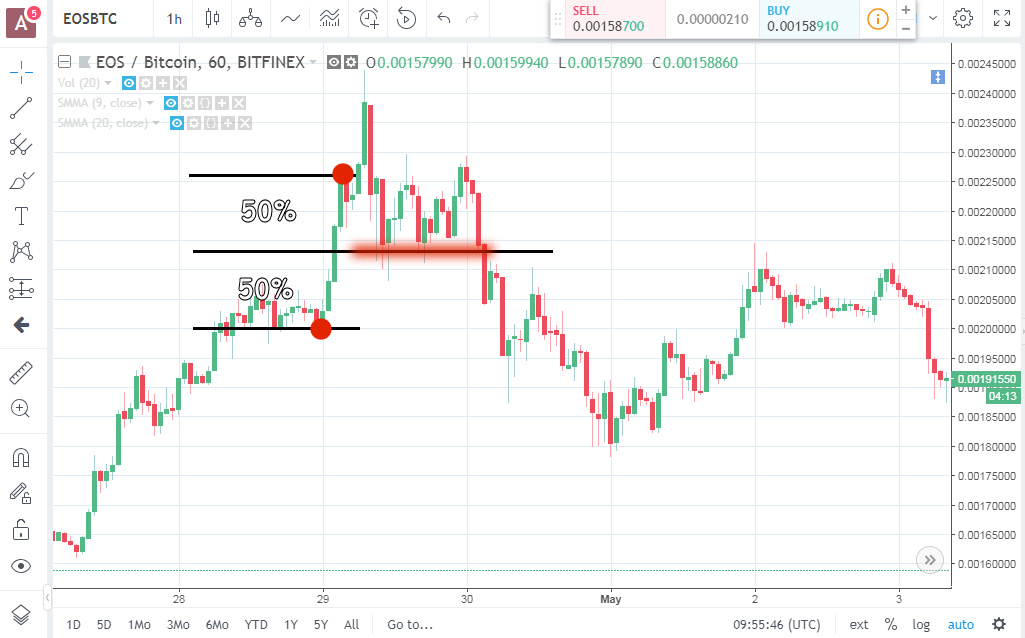
The next significant thing to note during that ranging period is the first pinbar, highlighted below. Some people would have thought that meant the price was going to go down and it did, but you shouldn't trade off them.
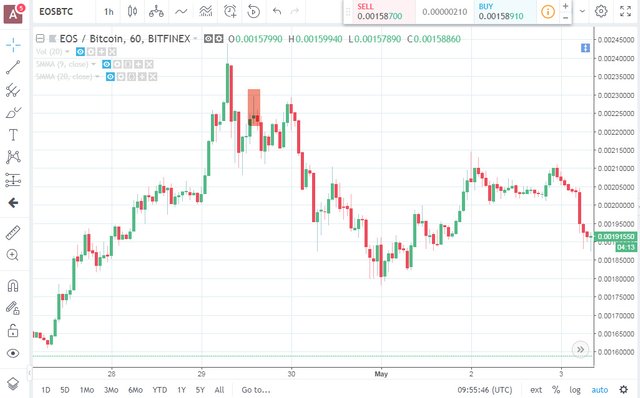
The thing is, once you see a pinbar, it's too late !. You've missed the trade. Everyone would have been waiting for confirmation of that pinbar, by the next candle breaking the low. That's a retail traders entry. If you didn't manage to buy at the very top of that wick, trades over, you missed it. Look at the awful risk reward ratio you would have got if you sold below the low of the pinbar with the stop above the high of it, just terrible.
At most, you could maybe have made a 1:1.5 R:R on that, not worth it. The people who managed to sell at the top of the wick would have done a lot better, maybe 1:10 or better. Don't forget, for the price to get there and back, some people were selling and some people were buying, guess which ones made the most money.
Ok, some other things to note. You could have made some quick trades throughout that ranging period, but only if you bought right at the bottom of that range, or sold right at the top. If you look at the support line when it first formed a low, you could have put a buy order on and hoped the price would have came back and triggered it.
But the price didn't, so nothing lost. That's pretty important, missing out on a trade is better than making a bad trade and losing money. The price came back down but never filled the order. C'est la vie ! Nothing lost, market will still be there tomorrow.

Note that the price made a higher low, which is why the buy never got filled, which could indicate instead that there is pressure to the upside and the trend up might continue. BUT ! don't forget about that pinbar... The price came all the way down off that huge high and then went back up to that pinbar high, but it didn't go any higher. That could indicate the bears are taking control, keeping the price down.
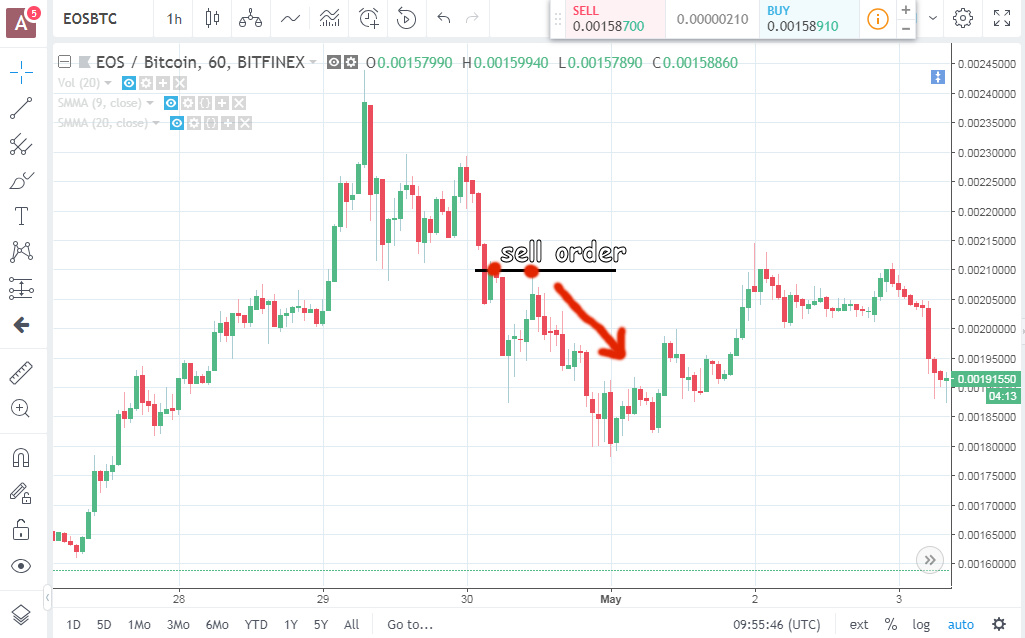
So I said pinbars are useless and you shouldn't trade them which is true, but they do serve a very good function. They literally point at where the sellers are ! You know that when the price got to that level it triggered a lot of sell orders which pushed the price all the way down.
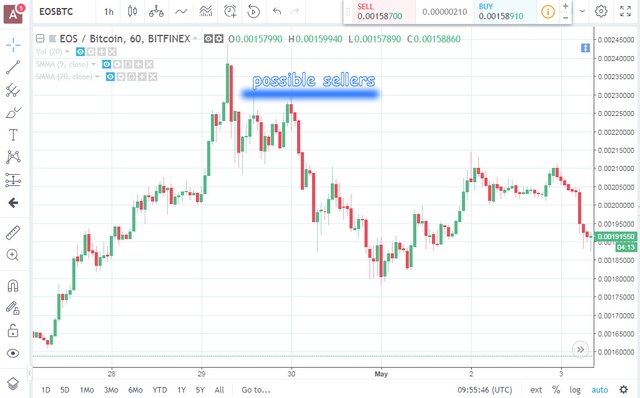
What do you think might happen when price gets back up to that level where all the sellers were ? There's a good possibility that all the people who didn't get their sell orders filled still have them on the system. And all the people who didn't have orders on and saw what happened, they'll put a bunch of new sell orders on at that point because they're pissed they missed out the first time.
Look what happened then when that level got hit again, it started a bear run that destroyed all those uptrends in a couple of candles. If you had managed to get a sell order on there, near the high of that pinbar wick, you could have been looking at a 1:40 R:R or higher, depending on how risky a stop level you used.
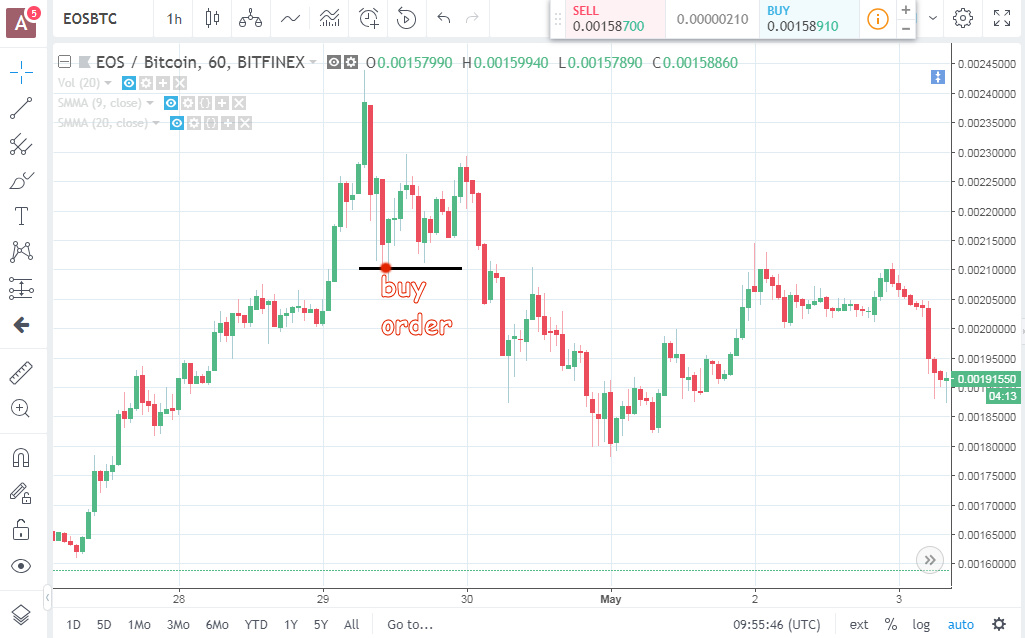
Carrying on...The next bit is the big bear run, which is kinda where you got involved. I marked it on the cross below.
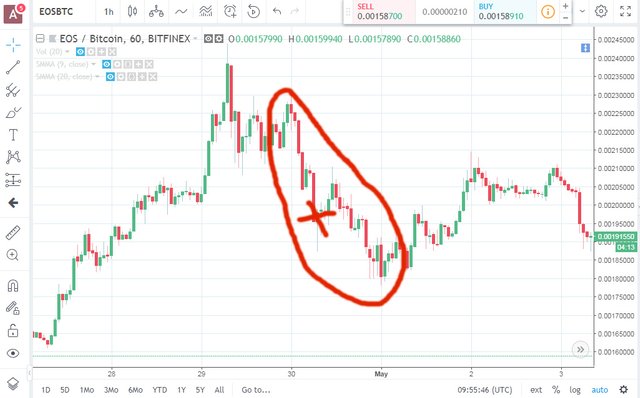
You bought around there, expecting the market to turn around and head back up. I believe the pinbar was what alerted you to the possibility ? As I said above, pinbar entries are for retail traders, if you didn't have a buy order waiting at the low of that pinbar wick then tough, too late, you missed it. How would you know where to put the buy order in advance ? That's another story...
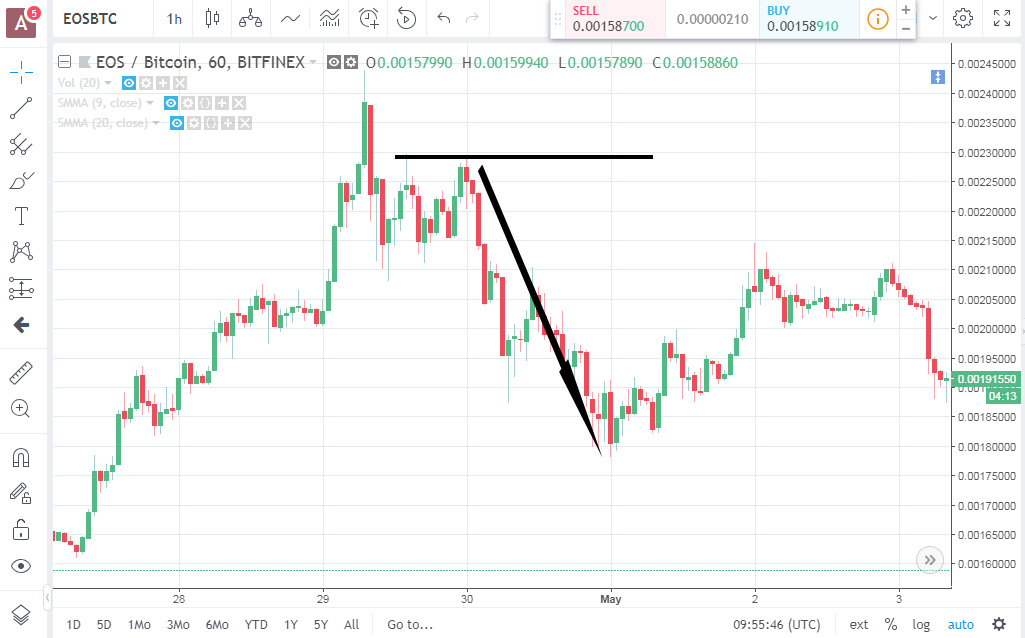
What you should have noticed first is the general trend, lower highs and lower lows which signifies 'downtrend'. Not a good place to be putting buy orders.
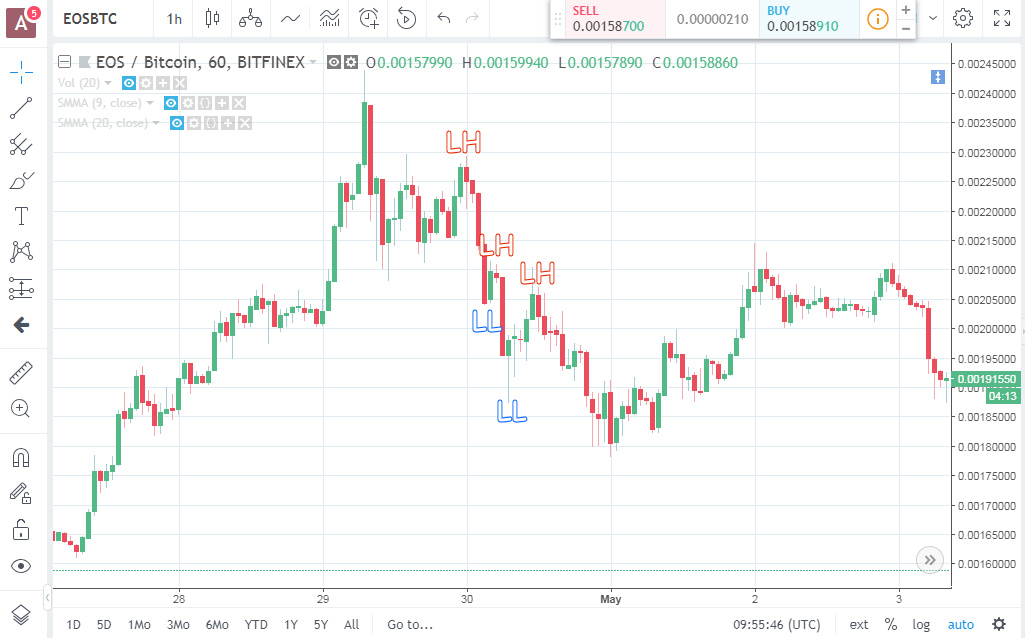
Until the chart tells you otherwise, the trend continues in the same direction. People get wiped out trying to guess trend changes and it's virtually impossible to figure them in advance. It's only looking at charts in hindsight, like we're doing now, that you can see them. Yet people insist on trying to trade them. Just go with the flow, a trend is a trend until it's not.
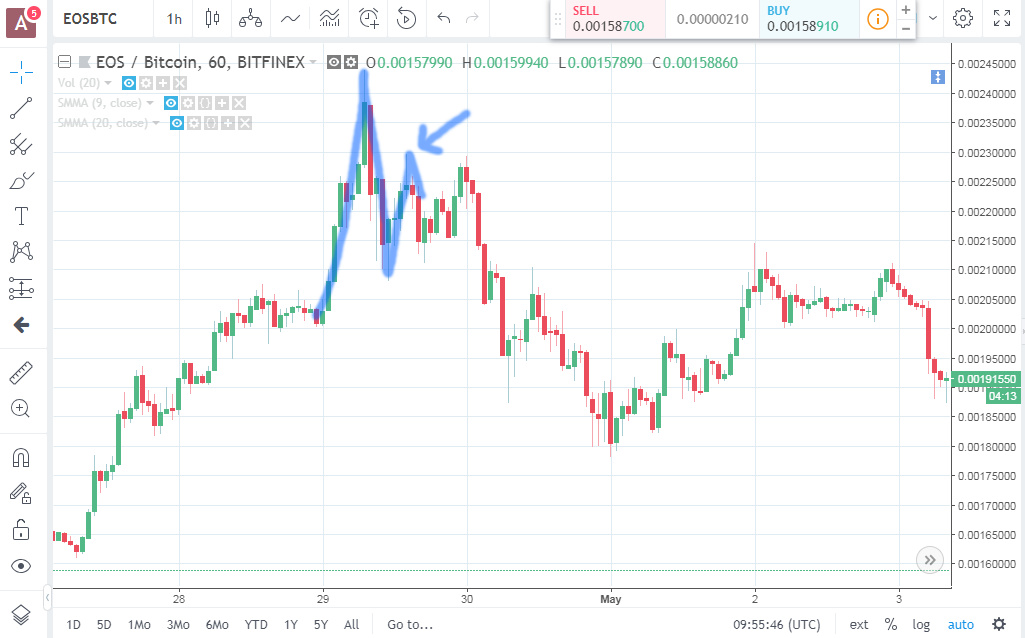
There's another little price action trade in that section that I'll highlight below. As above, a trend is always impulse > correction, impulse > correction. So if you missed the downtrend off that pinbar high before, you could wait for a pullback in the trend and get a sell order in. That little pullback halfway down would have been ideal.
If you had a sell order near the high of that pullback you could have entered the downtrend with a very small risk and high reward.
OK, enough for now, my fingers are getting tired lol. I could go on and on and demostrate other price action principles but I just wanted to give you an idea of trading without indicators. I'll sum it up a bit.
Very easy to say all this in hindsight, but I just wanted to show you the kind of thought processes for price action trading. It would have been possible to make some really great trades on this chart from price action alone. No indicators, no systems, just reading the chart and using common sense.
You just need to identify the trends and work out where all the buyers and sellers are. You never buy at market but use market orders to enter trades, let the price carry you into a trade, don't just buy on a whim. Be aware of 'professional entries' and 'retail entries'. It's much better to make lots of small losses with high risk for those huge winning trades. Retail traders do it the other way round, almost guaranteed trades but for shit rewards, if any.
You need to take risks to get rewards, as long as the rewards are much much bigger than the risks. I'm kinda trying to condense years and years of trading into one post here so I'll stop now, a lot of it just comes down to intuition after a while anyway.
I fully expect that another price action trader could come along and rubbish everything I've said, which is absolutely fine. If what they do makes money for them, then that's the right way to trade for them. If someone wants to use Elliot Wave anaysis or consult the I Ching (same thing, lol) then that's their trading method. Your bottom line is all that matters.
Any questions then please feel free below, and you owe me a bloody beer or something, lol.
So it seems following a trend is very important. Since the last financial crisis most indexes have been rising at a steady pace. So one would think that this will continue until proven otherwise.
No wonder I am a terrible investor. Been holding bonds for years and getting crushed now. Thanks.
Just remember that boom and bust cycles are built into the system, the next one is due in a couple years...
This aged well haha
Congratulations! Your post has been selected as a daily Steemit truffle! It is listed on rank 21 of all contributions awarded today. You can find the TOP DAILY TRUFFLE PICKS HERE.
I upvoted your contribution because to my mind your post is at least 38 SBD worth and should receive 143 votes. It's now up to the lovely Steemit community to make this come true.
I am
TrufflePig, an Artificial Intelligence Bot that helps minnows and content curators using Machine Learning. If you are curious how I select content, you can find an explanation here!Have a nice day and sincerely yours,

TrufflePigWhere did you go? Have not seen you in months? Everything all right?
Holy cow, nice..you should post your charts more.
The trade that the trader made was a countertrend trade back to the mean. I like the higher time frames and was looking for EOS to cotinue the trending up.
Which pairs do you like in forex and what commodities do you trade?
I love the GBP pairs (and will start posting my forex set-ups soon) and the Majors and like Crude Oil.
PS - the Community appreciates your tips and experience.
Thanks, much appreciated. I'm not a member of the investors club or anything, I just like following all the posts. I trade pretty short term mostly so not really 'investing' like you guys.
For Forex I trade all the majors and a couple of crosses. I only trade uncorrelated pairs where possible, for obvious reasons.
For commodities it's mostly metals that I know most about, but really I'll trade anything if I see an opportunity.
I trade indexes sometimes, usually the FTSE 100 or the DJIA. I try not to trade individual stocks, I prefer 'averaged' markets where one single event isn't a catastrophe. I prefer Forex because it's 24 hr, no gaps ! :-)
I do have some long term shares in battery technology, metals like Cobalt, Lithium etc. That's where the bulk of my money is right now.
I could see from reading several of your post, you are a short term trader. Do you ever trade the DAX? Yeah I think investing in Cobalt is a great idea. Most people don't know cobalt plays a significant role in car batteries and is more rare than lithium.
Sometimes trade the DAX, it just depends on what else is going on.
I usually try to trade different timezones, so if I'm in the FTSE then I won't trade anything else in Europe like the DAX or CAC40 as I find they can be quite corellated. If the FTSE is flat then I'll have a look around Europe though and vice-versa.
I expected eos to bounce at the 15 demand zone, looks like 11-12 is slowing it down. we will see
Great info and nicely written. Thanks for the effort.
To answer you question about what made EOS spike: nothing. EOS is in a "super hype" phase and is running off nothing other then unwarranted positive sentiment. It's a good coin, even a great coin, but it doesn't deserve to be so high up the market cap rankings.
For those who want to buy EOS: wait. It has a lot of dropping to do (relative to BTC of course).
P.S. Please can you show more Elliott Waves next time? :p
I wasn't too bothered about the cause of the spike, although thanks for filling that in. The theory of price action / naked trading is that everything about the stock is already reflected in the price, all the news, rumours, everything. It's a very 'pure' way of trading, nothing else matters except the price.
Your last comment is beneath my contempt... although I'd love someone to analyse that chart using them and see what they can pull out of their ass, sorry, 'predict' :-)
Notice how my analysis gave clear buy and sell signals at actual price levels that could easily be quantified and produce measurable results ? No wishy washy 5th wave maybe coulda shoulda nonsense ;-)
What do I always say ? anticipate, react, anticipate, react... lol
It's good to see you blogging regularly again after your semi-hiatus. Your info is even better than before, keep it going!
I dunno, am still in firey mode at the moment :-)
I saw another account joined last week, and after 4 'nothing' posts they're at level 57 and getting $300+ per post. And people still try to say the system isn't corrupt...
I did some digging and kinda figured out how they were doing it, it's like a bot exploit scam. Not bad, a $1000+ a week for doing nothing. Of course, that means another 100,000 users a week didn't even earn a single $0.01 but no-one gives a shit about them...
Shocking. I'm so sick of bots, wish they would just ban them already.
I saw a post the other day, and I swear to God, it had over 20 bot upvote comments... Not a single human.
The post had about $100 or something, and even had one of those "you're raping the reward pool" type bots on it, listing all the payments !
I've half a mind to just buy $250K Steem and go on a rampage, lol.
Wow! Got a link? I'd love to see that!
I just finished a post (after the usual several hours it takes) and then, as usual, I scrolled through the crypto posts to read a few other peoples' stuff. I commented on one post, and then noticed the same author a few minutes later - weird. But when I noticed the third...
The guy had posted 5 posts within 32 minutes! COME ON! Where is the quality in that! What BS! Self-serving little pri##.
Now you know why I get fed up writing a post for 3 hours and then think, is this really worth it ?
That's why a laugh at the "This is how to become successful on Steemit !!" type posts. Especially when you look at their reward and see they made $200 by scamming the bot system for it, hypocrites.
Thank you @tradergurl for putting so much thought and work into something which was a very small trade. It means a lot to someone like me who is trying to put what I learn into practice.
I am enjoying my weekend (hope you are too) so have only read this without getting into too much detail, but wanted to say thanks as soon as I saw the post. I will have another read and will comment if I have any questions :)
no problem, you're welcome :-)
I though it might be interesting to the readers of @tradergurl 's orignal post. Below is a chart of TRX/BTC which is showing an identical pattern to what we've seen described in the post.
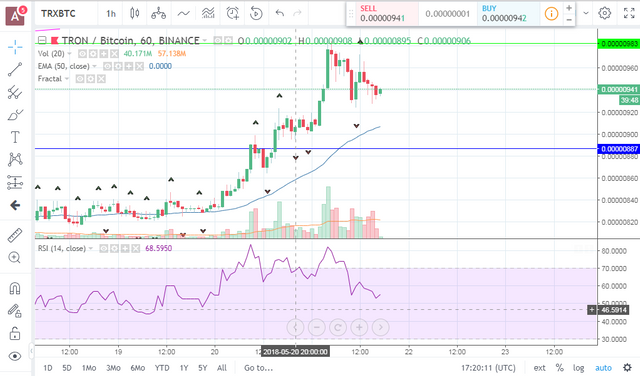
It looks like 29th of April (on the EOS chart) is where we are today with TRX.
It'll be interesting to see if the patter repeats itself.
Interesting ! Remember Gamblers Fallacy though, because a pattern happened once doesn't mean it'll happen again.
At any single point there's a 50/50 chance the price will go either way. All you can do is stack the odds in your favour and manage the trade well, win or lose.
They're definately some sellers in the (blue area) so it might be worth a cheeky sell order around there somewhere. But... it still looks like an uptrend overall so probably woudn't go mad on the stop level being too far away.
Looks like an awesome post and I'm looking forward to reading it all tomorrow when I have the time.
My initial reaction was - WHAAAAAAAT?! A crypto chart?! ;-)
hey, don't hold it against me... :-) I know crypto people like to think that crypto is all mysterious and requires some kind of special knowledge to trade it... but then again most people are full of shit and don't make any money lol.
Congratulations @tradergurl! You received a personal award!
Click here to view your Board
Do not miss the last post from @steemitboard:
Vote for @Steemitboard as a witness and get one more award and increased upvotes!
Congratulations @tradergurl! You received a personal award!
You can view your badges on your Steem Board and compare to others on the Steem Ranking
Do not miss the last post from @steemitboard:
Vote for @Steemitboard as a witness to get one more award and increased upvotes!