Hunting for two legged donkeys
How's that for a clickbait title ? :-)
Everyone is probably sick of looking at the (multitude) of bad technical analysis posts, so I thought I'd do a post on what it means to trade price action instead. Before I even start I know it's going to be a long post, so get a coffee or something first lol.
Price action trading means trading with little or no indicators whatsoever, just using the price alone to guide you in and out of trades. Most people still swear by technical analysis, despite the fact it's been proven no more successful than a 50/50 guess in a variety of studies.
Don't get me wrong, I trade on technical analysis too. One of my main systems is purely mechanical based entirely on a technical indicator, although I admit it only uses a single indicator and even then I don't use it how it's supposed to be used... lol.
But please don't take this as an entire dig at TA, it works for some people. This is just an introduction to another side of trading that isn't often talked about (especially on Steemit where everyone is a TA 'guru').
I'd consider myself to be mostly a price action or 'naked' trader (steady boys !). Some people, myself included, think that everything you need to know about a stock is reflected in the current price. The price alone is used to measure the sentiment of the market, no need for indicators which are a derivative of price and by definition one step removed.
There are many types of price action strategies, one you probably know already is support and resistance levels. They work because there's sound logic and reasoning behind them, they include the psychology of the traders.
My own particular speciality is 'trapped traders'. I look for people in pain and try to remove their money from them. I know, doesn't sound great but all will become clear once I've worked through an example ! Think of it like euthanasia, helping to relieve people of their misery.
There are two types of trapped traders, people trapped in losing trades, and people trapped out of winning trades. If you can identify these people then you can make money from them.
Enough of the waffle, on with an example. This example probably isn't the easiest one to understand and a tiny bit complicated, but hopefully it will give you a great idea of how naked or price action trading works and an insight into the mind of the people who do it. These are the people that new traders lose all their money too.
In the market, there are various groups of people in a constant battle with each other. On the one hand you have the institutional traders, hedge funds, banks etc and they're very rarely wrong. Then you have the retail traders, which is you and I. Out of the retail traders there are those that are successful and then the vast majority that aren't. On top of that, it's further divided into subsections of people who think the market is going to up at any point (bulls, longs), and those who think it will go down at the same point (bears, shorts).
That's all the market forces in play, and this is how to take advantage of it. This is called a 'two legged pullback', it not something I invented, just something I learned that I want to pass on if you haven't seen it before. The 'donkeys' are the trapped traders, the 90% of retail traders who don't make money.
So, a market has been in a bit of a downtrend and looks a little something like this.
You first ask yourself,
who is in the market at the moment, and who isn't but would like to be ?
The chances are, the institutional traders are short and making money. Some retail traders who made good decisions earlier are also short and making money. But waiting in the wings are bears who missed the opportunity to short earlier, and waiting for a pullback to go short. And there are also bulls who believe the downtrend is nearly over and are waiting to buy / go long at the first sign of a reversal.
Then a couple of bullish candles appear signifying a possible pullback or trend reversal.
The next candle is small, and trades within the range of the previous one, indicating indecision in the market. This is sometimes called an 'inside day' or if it's gapped as shown, a 'harami'.
The indecision means the price can go either way. Either the trend has reversed, and it's a small pullback before going higher, or it's simply a small consolidation before the trend continues downward.
This is the point now where the people waiting in the wings come into play, the bears who missed out on the original downtrend and the bulls who are betting on a trend reversal to the upside.
First of all from the bears point of view. They missed out earlier and think the trend is going to continue down, so they're desperate to get in on the action. Conventional wisdom (learned from YouTube...) says put a sell stop below the low of the inside day that will get triggered if the price continues lower, and then put a stop loss above the latest high.
The bulls on the other hand, they think the price is going to go up, so they put in an order to buy if the price goes above the recent high (the same place that the bears would set their stop loss)
The next candle, the price continues lower, and all the bears are now in the market short.
The bulls are still hoping for a reversal, so they keep their orders on and hope the price turns around and heads up.
The price does indeed make a small reversal, making the bears who just entered short a little twitchy as it heads toward their stop level. The bulls on the other hand are quite happy, because they think the trend might have reversed and their buy orders are going to filled !
The price continues to climb, and all the recent bears get stopped out, losing money.
Now at the same time, all the buy orders from the bulls are now filled and they're in the money heading north. They put their stop levels below the low of the entry candle, as YouTube instructed them to.
Now back to the poor bears. They had a day at the seaside and now they've got sand in their vagina. Not only did they miss the original downtrend, but their attempt to jump on the trend also failed. Now they're pissed.
They're now doubly determined to get back in the action and recoup their recent loss. They refuse to believe they've made a mistake and still think the price is going down. Some will even double up and risk more money, trying to 'revenge trade' and teach the market a lesson. So like good little YouTube boys and girls, they put sell orders under the low of the recent candle and pray for a reversal to the downside.
What happens next is a thing of beauty. This is where the institutional traders who missed the original downtrend join the fun, along with the retail traders who understand price action and have seen this trick before. They both put sell orders on the same place as the bears.
Now imagine what happens if this occurs...
I'll explain in terms of what happens as that red line gets broken.
The bulls who were long earlier, that's where their stop losses were set, so they fill the market with sell orders.
The bears who missed out twice and are now revenge trading, they also fill the market with sell orders.
The institutional investors who want to see the downtrend continue, they fill the market with sell orders.
And lastly, the retail price action traders who saw this coming, they also fill the market with sell orders.
Now imagine what happens to the price when all those sell orders simultaneously hit the order book ? Yeah, it looks something like this -
Now for the roundup, how did everyone do ?
The bulls, who bet on a reversal and failed, are out of the market with a loss. The bears, they got stung but came good in the end. But they probably only had a 2:1 risk reward ratio (as taught by YouTube) so coupled with their earlier loss they maybe just broke even. The crafty retail traders who knew what was going to happen, they've all got 10:1, 20:1 risk reward ratios and milk that drop for all it's worth. And the institutional traders, they're probably still in the trade for the long haul.
So that's pretty much a good example of what price action is and how to use it. A little complicated example because of the 'double whammy' but I thought it would be more interesting to show than a single one.
By the way, did you notice any indicators on the charts above ? Where were all the Elliot Waves ? Where are the Ichimoku Clouds ? Fibonacci retracement levels ?? Simply put, they're not there because the market doesn't give a shit about magic lines drawn randomly on a chart. The only thing that matters is the price action and psychology of the involved parties.
OK, that was a bit harsh, I don't mean that all TA is bunk (well maybe with the exception of Elliot Wave Analysis, which has the same relationship to trading as Andrew Wakefield had to the MMR vaccine lol).
I still use indicators, I still use mechanical systems, but only on short timescales for small profits. For really big wins, you need to be thinking about price action instead. That may be support and resistance levels, channel breakouts, or just swing trading. Some indicators and TA can help, but what matters is what the price is actually doing.
There are lots of price action 'tricks', it's just a case of learning to spot them. My post above was a pure textbook example of a 'two legged pullback', obviously in the real world they are nowhere near as neat or obvious or common.
If you want to price action trade you need to start putting yourself into the mind of the people that are going to lose money, try to work out where all the stops are and what will happen when they get hit, where all the pressure points are.
You need to find people that are in pain, either trapped in a trade that's going against them or trapped out of a trade that they missed and want to get back in. Mostly though it's just common sense.
Fek, that was a long post ! lol
Header image credit - Unknown, found via Google image search, multiple locations.
About me -
I'm a full time financial trader, mostly in Forex and Commodities. I write for fun and try to help beginner traders get started, avoiding all the mistakes that I made. I'm always happy to chat or discuss ideas so please just give me a shout in the comments !
100% of anything I earn from this post will be donated to a Steemit charity or worthy user.
Nice post. Doesn't look like you are getting the votes you deserve though. You should check out steemengine.
Hello tradergurl!
Congratulations! This post has been randomly Resteemed! For a chance to get more of your content resteemed join the Steem Engine Team
Great post. "...support and resistance levels. They work because there's sound logic and reasoning behind them, they include the psychology of the traders." TA advocates would argue this is built into TA and can be seen in graph form by the movement of the lines.
TA is like the weather. Easy to explain why it happened afterwards, yet difficult to predict. Elliot Waves especially so. I SEE them on my charts, but I really struggle to make any form of prediction with them. I have started experimenting with them, but I really only use them to make my charts look more natural, they have little to no predictive value.
There are some very reliable TA indicators: especially those based on resistance levels. I cried out loud when I spotted this: (please excuse the cellphone TA!)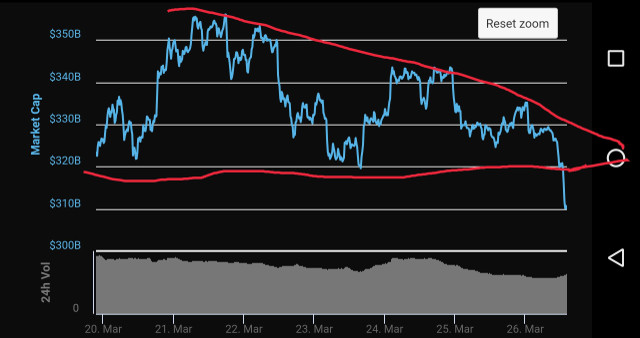
the $320B line was hit and I knew what was coming next. That and the crying toddler next door ruined my afternoon nap!
I find flat topped and bottomed triangles to be almost foolproof. There are other good indicators too. But the more you dig into "technical" TA, the more it will fail you.
I DO know what you mean and I share your frustrations. Some people speak of TA as if it is the divine law: "the price will rise to 8475.23 at the top of Wave 5", forgetting that markets are capricious animals and that TA is also open to interpretation. The shorter the term, the less reliable it is too. And even if you have done GREAT TA, the "shit happens" rule could still render your charts worthless!
But don't hate it all. It IS useful, I promise you that. Start looking for those flat topped and bottomed triangles. Not the ones at an angle, the ones with a perfectly horizontal side (a resistance or support level). They are truly reliable.
I think we have a difference in our definitons, I would call triangles and flags, penants etc price action not technical analysis.
To me, technical analysis is using indicators based on historical data to predict the future. Price action is about the 'structures' in the market, with the underlying psychology that makes them happen.
Most people forget that indicators are lagging. So when people say 'the price is going to bounce off this moving average' they don't understand that price has already moved, it doesn't care what the moving average is.
It's just unfortunate that price action gets lumbered in with technical analysis, as opposed to fundamental analysis. There should be three fields, not just two.
I think we agree, just use different terms to describe the same thing :-) lol
I think from now on I'll just call it all "chart stuff". Problem solved. 😀
You are such a great resource person. Thank you for your donation to @SchoolForSDG4. I am so happy to have your support. I invite you to read our monthly report which helps me to share about school's expense and earning. The school is fully funded by steemit users and it has a great support from all of you.
thank you, I've just sent you another donation. I make almost entirely nothing from Steem but your welcome to it !
Thank you again. I mentioned you in latest post from @Azizbd . I hope you will get more exposure and your talent in trading will be valued. Will follow your work more often.
thanks, am just glad the money is going to good use
may i ask, who would you recommend reading on price action trading? I tried al brooks and it was pretty tough. is there anyone you recommend?
excellent article, very good explanation of two-legged pullback. I got a question about price action trade. How come you don't look at volume data since it is related to the orders?
Wouldn't a higher volume bar also mean that it could be stronger demand/supply??