RE: Hunting for two legged donkeys
Great post. "...support and resistance levels. They work because there's sound logic and reasoning behind them, they include the psychology of the traders." TA advocates would argue this is built into TA and can be seen in graph form by the movement of the lines.
TA is like the weather. Easy to explain why it happened afterwards, yet difficult to predict. Elliot Waves especially so. I SEE them on my charts, but I really struggle to make any form of prediction with them. I have started experimenting with them, but I really only use them to make my charts look more natural, they have little to no predictive value.
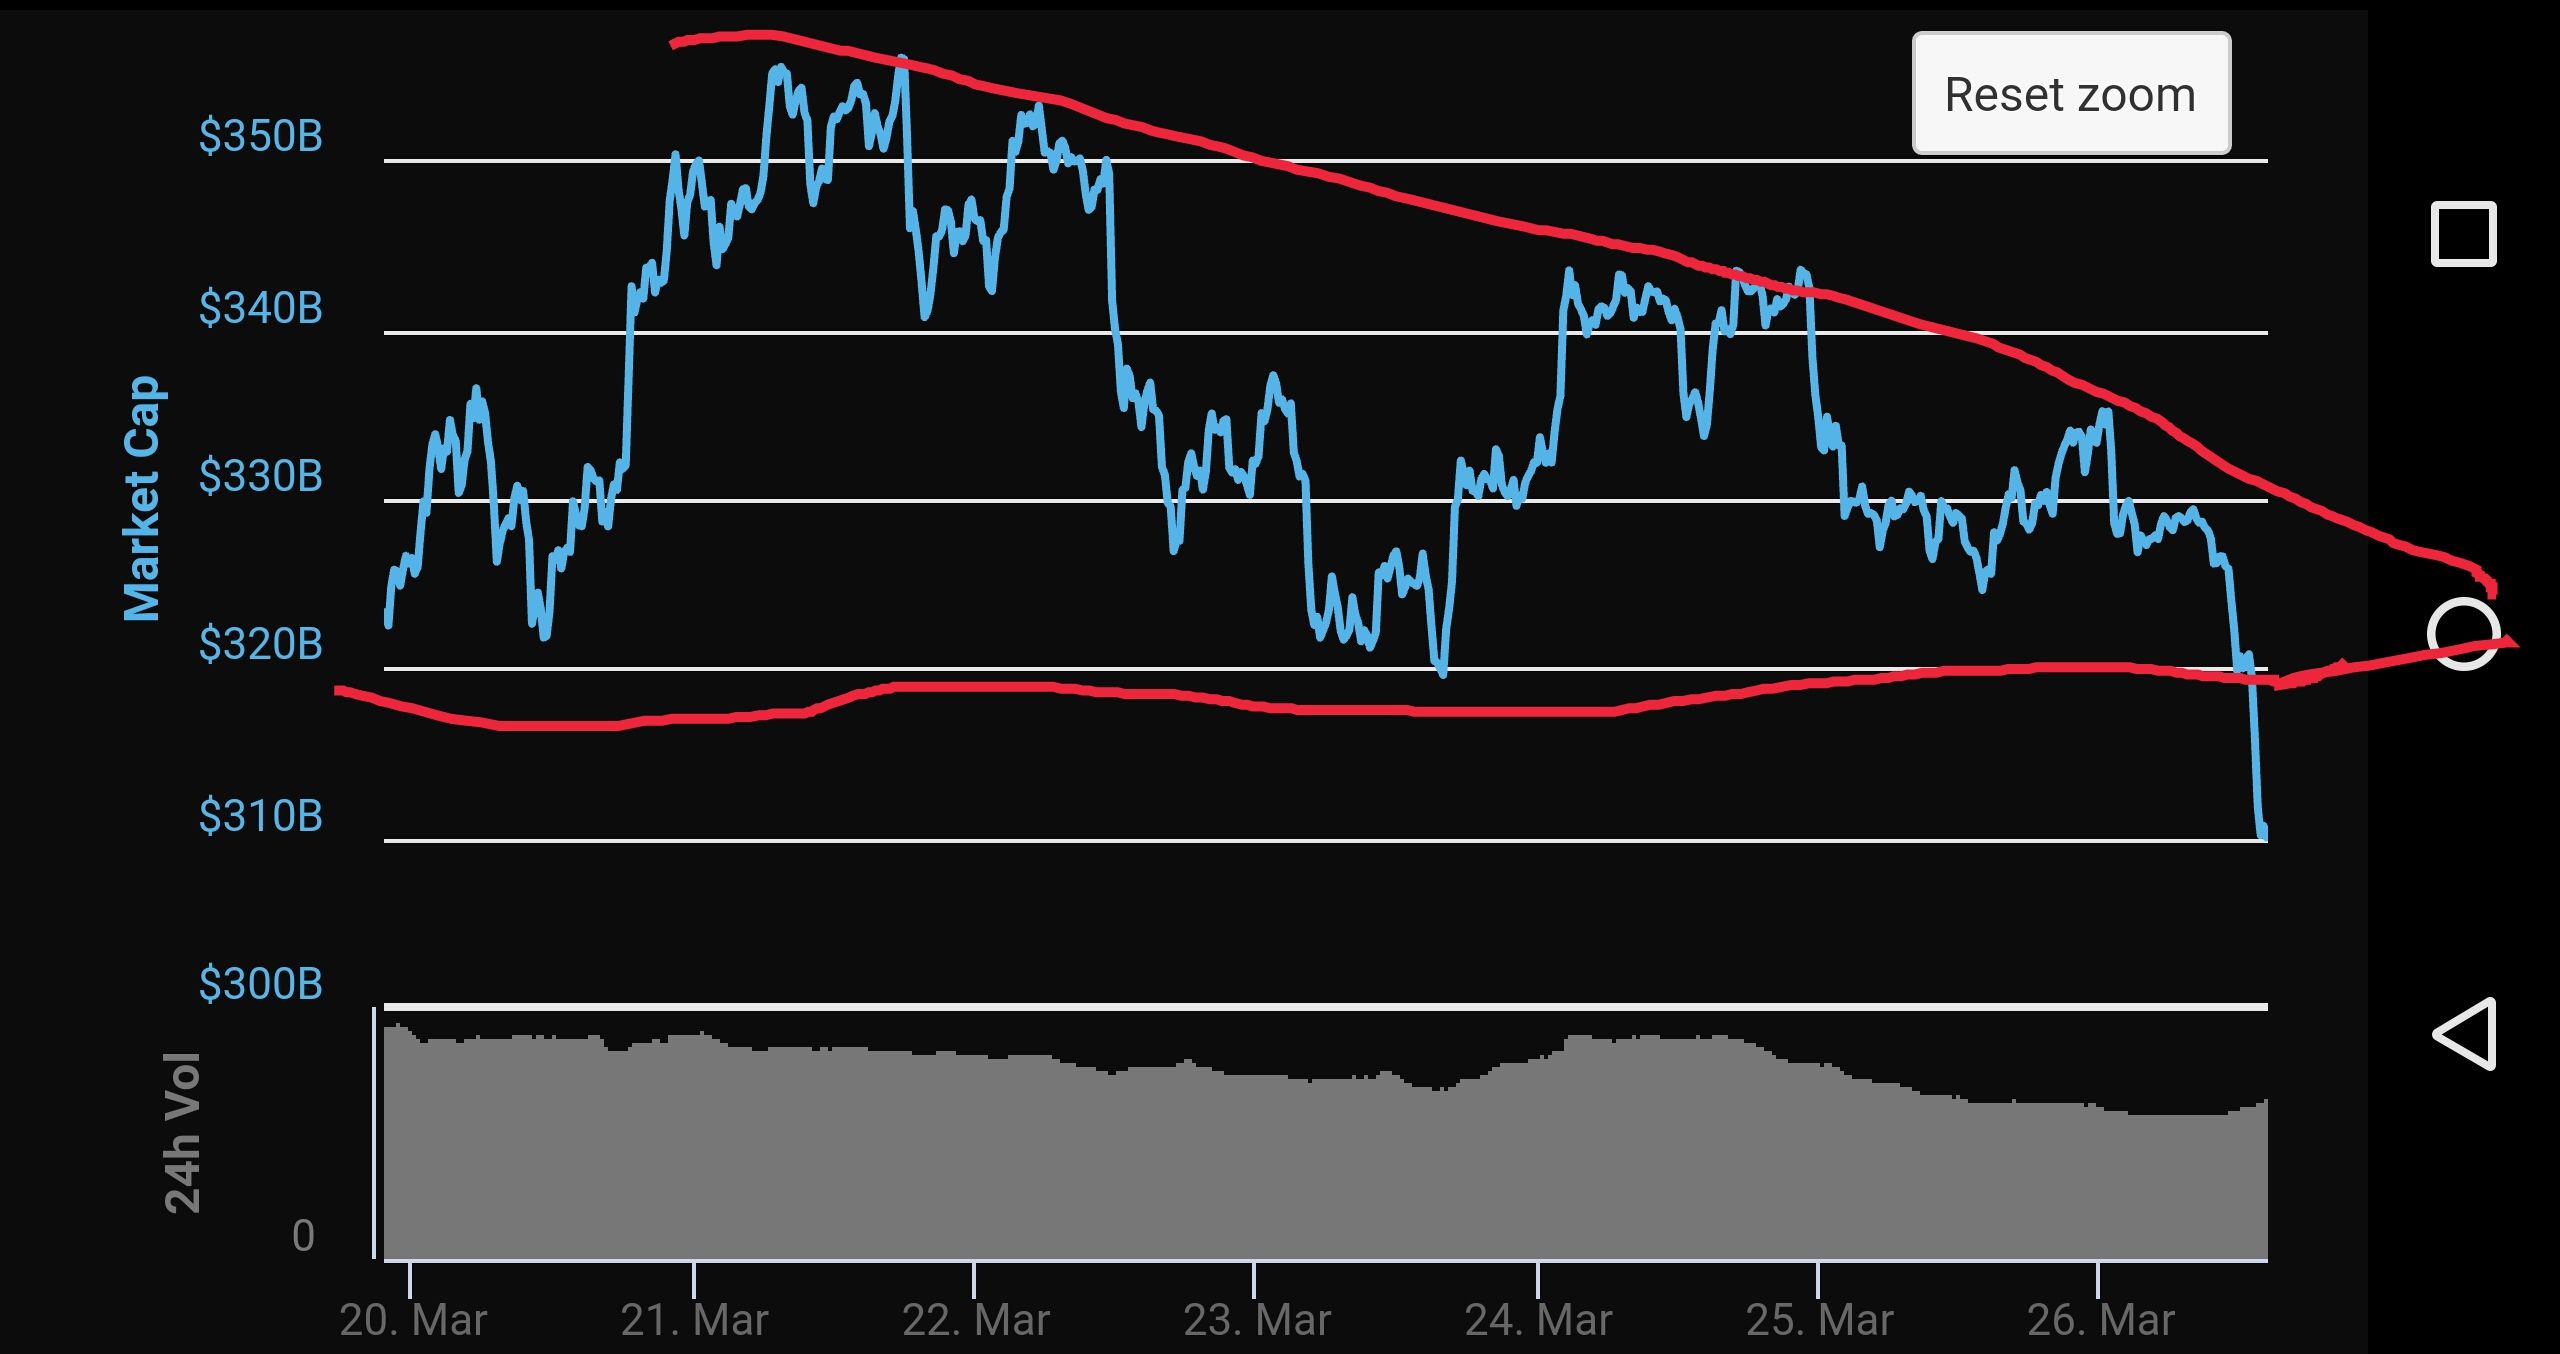
There are some very reliable TA indicators: especially those based on resistance levels. I cried out loud when I spotted this: (please excuse the cellphone TA!) 
the $320B line was hit and I knew what was coming next. That and the crying toddler next door ruined my afternoon nap!
I find flat topped and bottomed triangles to be almost foolproof. There are other good indicators too. But the more you dig into "technical" TA, the more it will fail you.
I DO know what you mean and I share your frustrations. Some people speak of TA as if it is the divine law: "the price will rise to 8475.23 at the top of Wave 5", forgetting that markets are capricious animals and that TA is also open to interpretation. The shorter the term, the less reliable it is too. And even if you have done GREAT TA, the "shit happens" rule could still render your charts worthless!
But don't hate it all. It IS useful, I promise you that. Start looking for those flat topped and bottomed triangles. Not the ones at an angle, the ones with a perfectly horizontal side (a resistance or support level). They are truly reliable.
I think we have a difference in our definitons, I would call triangles and flags, penants etc price action not technical analysis.
To me, technical analysis is using indicators based on historical data to predict the future. Price action is about the 'structures' in the market, with the underlying psychology that makes them happen.
Most people forget that indicators are lagging. So when people say 'the price is going to bounce off this moving average' they don't understand that price has already moved, it doesn't care what the moving average is.
It's just unfortunate that price action gets lumbered in with technical analysis, as opposed to fundamental analysis. There should be three fields, not just two.
I think we agree, just use different terms to describe the same thing :-) lol
I think from now on I'll just call it all "chart stuff". Problem solved. 😀