Top 5 most powerful Bullish candlesticks patterns
To be successful in trading either its forex, stocks or cryptocurrency, you should know all the basic knowledge regarding candlesticks, indicators, money management, stop-loss- take profit.
Today we are going to study about the top 5 candlesticks which indicate that the market is about to go bullish(UP).
*What is Candlestick pattern?
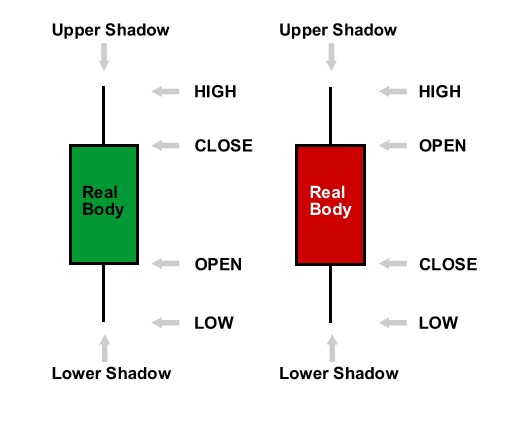
A candlestick pattern is a movement of prices it gives us the current & historical pieces by high, low, opening and closing prices of a security for a specific period. The wide part of the candlestick from opening to closing price is called real body of the candle. The shadows of the candlesticks show the high & low price of that candlesticks. The white/green candlesticks shows the price is increasing & black/red candlesticks shows the price is decreasing.
- HAMMER
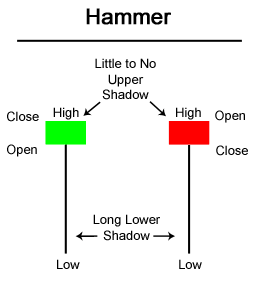
The hammer is a type of most important bullish reversal candlestick pattern. This single candlestick is used by many traders to trade stocks, ETFs, commodities and forex. This is a powerful candles with one long lower shadow that occurs when a markets significantly lower than its opening price, but rallies later in the day to close either above or near its opening price. The candle looks like exact as hammer, to form exact like the hammer the leg of hammer should be at least double of its real body then it indicates a very bullish signal.
When you see the hammer after a downtrend this is a great sign of a potential reversal of the market but before placing any order you should weight for the next candle to open higher than the close of the previous candle to confirm the bullish signal.
Criteria for signal
The lower shadow should be at least two times the length of its real body.
The real body should be at the lower end of the trading range.
The color of the body is not important although a white/green body should have slightly more important for bullish signal.
There should not be an upper shadow or a very small upper shadow.
The another candle needs to confirm the Hammer signal with a white/green candle & a gap up with a higher close.
The longer the the lower shadow of Hammer, the higher the potential of a reversal occurring.
A little gap up from the previous day close sets up for a stronger reversal move provided the day after the Hammer signal trades higher.
The candle should be formed at the support zone or over bought zone
Inverted Hammer
The Inverted Hammer is a type of bullish reversal candlestick pattern. This is a powerful candles with a long shadow that occurs when a market significantly higher than its opening price, but rallies later in the day to close either above or near its opening price. The inverted Inverted Hammer looks like an upside down version of the Inverted Hammer candlestick pattern, the upper shadow of inverted Inverted Hammer should be at least double of it`s real body then it indicates a very bullish signal, and when it appears in an uptrend is called a Shooting star.
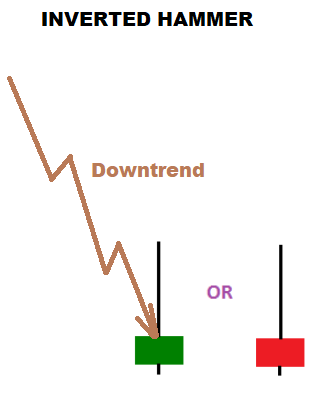
When you see the Inverted Inverted Hammer after a downtrend this is a great sign of a potential reversal of the market but before placing any order you should weight for the next candle to open higher than the close of the previous candle & should be closed above of the previous candle to confirm the bullish sign.
Criteria for signal
- The upper shadow should be at least two times the length of its real body.
- The real body should be at the upper end of the trading range.
- he color of the body is not important although a white/green body should have slightly more important for bullish signal.
- There should not be an upper shadow or a very small upper shadow.
- The another candle needs to confirm the Inverted Hammer signal with a white/green candle & a gap up with a higher close.
- The longer the the upper shadow of Inverted Hammer, the higher the potential of a reversal occurring.
- A little gap up from the previous days close sets up for a stronger reversal move provided the day after the Inverted Hammer signal trades higher.
- The candle should be formed at the support zone or over bought zone.
- Bullish Engulfing
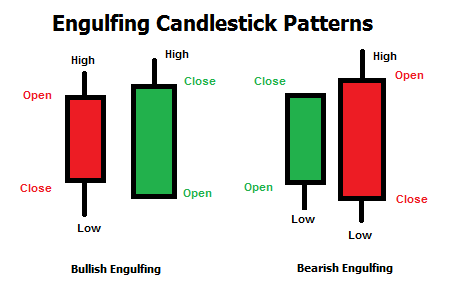
A bullish engulfing pattern is a reversal candlestick pattern which is bullish in nature and appears at the end of a down trend. It occurs when a small bearish candle is engulfed by a large bullish candle. The first candle is a falling black candle and the second candle is the reversal white candle.When a bullish engulfing candle forms at the end of a downtrend, the reversal is much more powerful.
Before placing any buy order you have to check the support line by using horizontal support line trend line etc & over bought zone by using the indicators RSI, Stocastics etc, when you get any one confirmation from support & overbought then you can buy the stocks
Criteria for signal
- The body of the second day candle should be completely engulfs the real body of the first day candle.
- The prices should be in a definable down trend.
- The body of the second candle is opposite color (white/red) of the first candle.
- The greater the open gaps down from the previous close, the greater the probability of a strong bullish signal.
- The bullish engulfing candlestick pattern should be formed at the support zone or over
- Piercing Pattern
Piercing Pattern is a reversal bullish candlestick pattern appears at the end of a down trend. The pattern is formed by the combination of two candlesticks. The first candle is bearish (Red/Black) and the second is bullish (Green/white). The price opens at almost high of the day and & the price closes almost at the bottom. This results in the formation of bearish candle, which is the first candle of the piercing candlestick pattern. The price of second candle opens below the low of the previous bearish candle & it must close above the middle of the real body of the first candle.
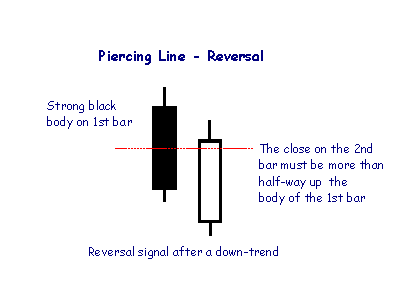
Criteria for buy signal
- The first day candle should be black/red & occurs at the end of the down trend.
- The second day candle should be opens lower than the trading of the previous day.
- The white/green candle should be closed more than halfway up of the black/red candle.
- The longer the black candle and the white candle, the more powerful the reversal.
- The greater the gap down from the previous days close, the more powerful the reversal.
- Large volume during these two trading days is a significant confirmation for the bullish signal.
- Piercing Pattern should be formed at the support level or over bought zone
5.Doji
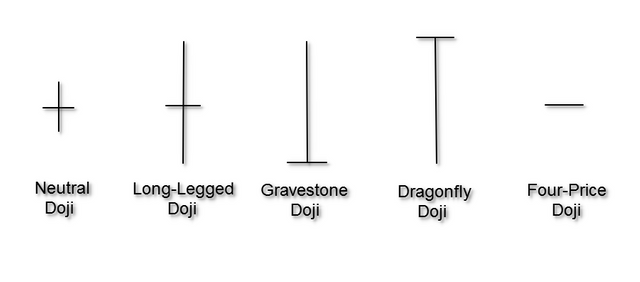
A Doji is formed when the opening price and the closing price are equal. Many traders think that this candlestick pattern is one of the best pattern to trade. There are mainly five types of doji & they are given below.
Neutral Doji
A Neutral Doji is a small candlestick pattern & look like a cross or plus sign. This pattern occurs when the stock open and close at the middle of the day’s high and low.
Long-Legged Doji
A long-legged doji has the upper and lower shadows are much longer than the natural doji. During any time frame of the candle, the price dramatically moves up and down but closed at the same level that it opened. This pattern forms when supply and demand forces are at equilibrium & This shows the indecision between the buyers and the sellers.
Gravestone Doji
A gravestone doji is formed when the opening and closing price are equal and occur at the low of the day. This pattern forms when the supply and demand forces are at equilibrium.
Dragonfly Doji
The Dragonfly Doji is formed when the opening and closing prices are equal and occur at the high of the day. This forms when the supply and demand forces are at equilibrium.
The 4 Price Doji
The 4 Price Doji is simply a horizontal line without any upper & lower shadow, it looks like minus sign, the high, low, open and close prices of the candle are exactly the same.
Criteria for buy signal
The first thing that you need to know is that a doji is only significant after an extended move to the upside or an extended move to the downside. Also, the doji should be at a support area or over bought zone. These patterns are used as entry and exit points. When the Doji forms at the support level, it can be used as an entry point. Similarly when the Doji forms at the resistance level, it can be used as an exit point.
....................................................................................................................................
If you have any question or confusion regarding above information you can comment , I will try my best to resolve all of that.
Congratulations @ngndra! You received a personal award!
You can view your badges on your Steem Board and compare to others on the Steem Ranking
Do not miss the last post from @steemitboard:
Vote for @Steemitboard as a witness to get one more award and increased upvotes!
Thank you for the nice content https://9blz.com/bullish-engulfing-candlestick-pattern/