Litecoin on the move from it low,
Charts are showing a nice trend,
In the near future there is a positive indicator of a pull back from the values on the 20th of April 2018,
From the Fib overlay on the Elliot wave a resistance in the €124 to 127 range for the 20th 21st April
Legal Disclaimer: I am not a financial advisor nor is any content in this article presented as financial advice. The information provided in this blog post and any other posts that I make and any accompanying material is for informational purposes only. It should not be considered financial or investment advice of any kind. One should consult with a financial or investment professional to determine what may be best for your individual needs. Plain English: This is only my opinion, make of it what you wish. What does this mean? It means it's not advice nor recommendation to either buy or sell anything! It's only meant for use as informative or entertainment purposes.
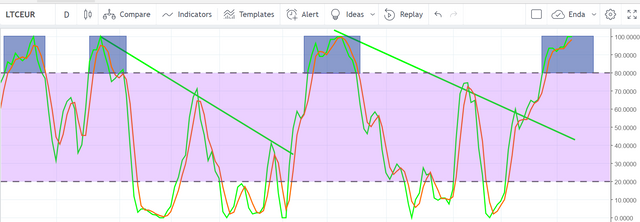
As predicted from the analysis on the 20th April, the Charts are showing a change in direction, the price hit a predicted high of between €124 and €127 actual was €128 before retreating back to a day low of €114 and then settling back into the €119- €123 range .
According to the Elliot wave formation this occurrance was in wave 3 to 4, thus suggesting that we are in for another movement in the upwards direction over the coming cycle
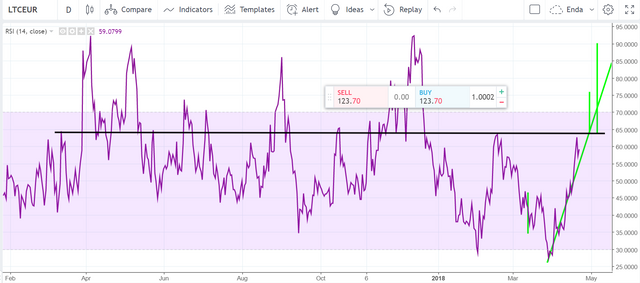
On the RSI indicator , the trend line tested the 64% resistance line( black line) and retreated from this significant indicator, suggesting momentum shift from the market.
![SRSI21stApril2018.PNG]
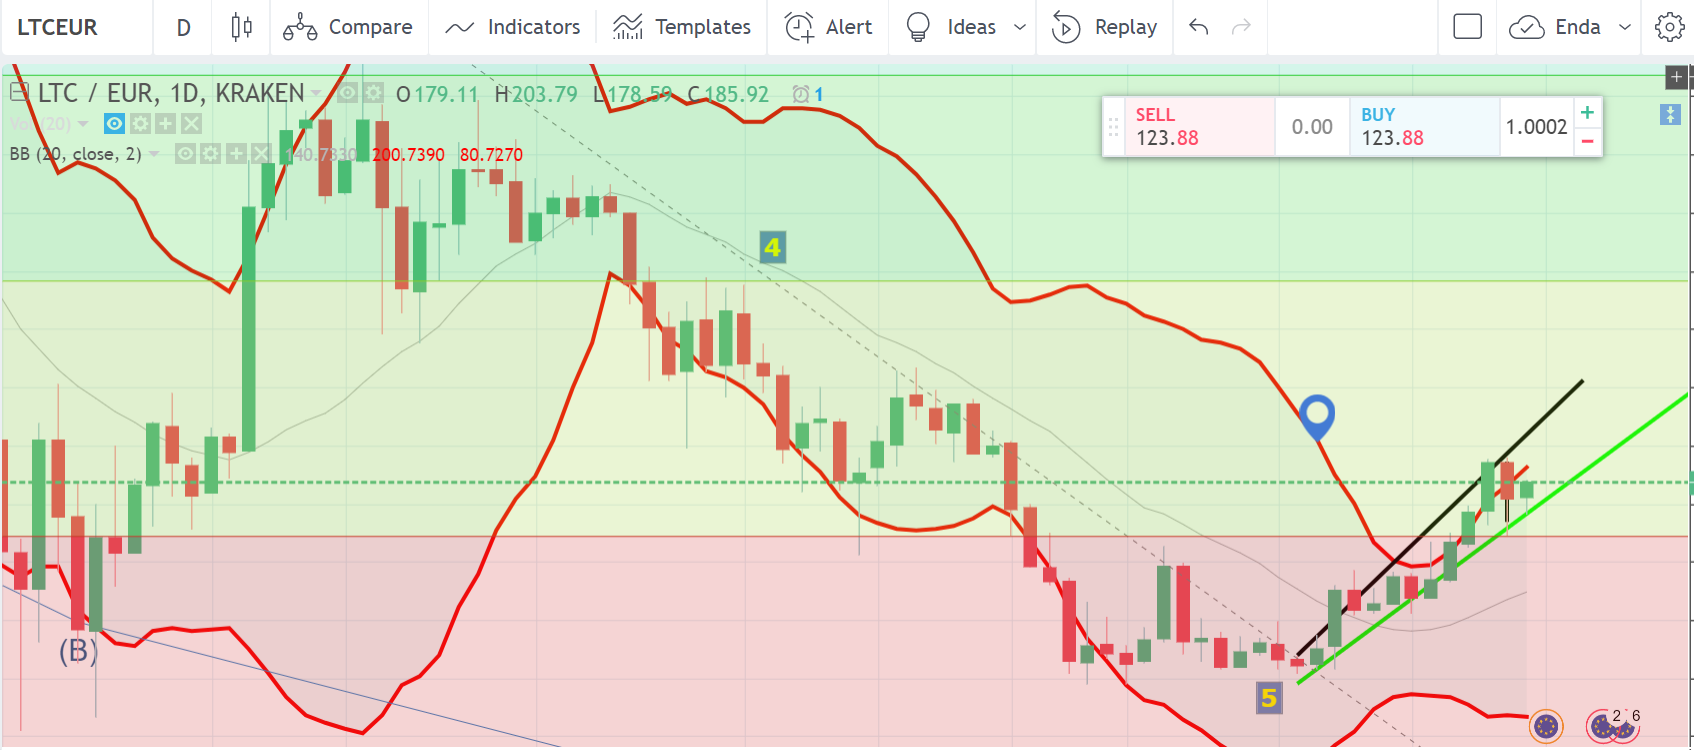
How this all looks on the Candle stick chart for LTC
![Candle21stApril2018.PNG]
What do the charts hold for the future ,
25th April a potential €140 range with support line of €128
Any directional change negatively will be driven by Market forces (FUD)
Legal Disclaimer: I am not a financial advisor nor is any content in this article presented as financial advice. The information provided in this blog post and any other posts that I make and any accompanying material is for informational purposes only. It should not be considered financial or investment advice of any kind. One should consult with a financial or investment professional to determine what may be best for your individual needs. Plain English: This is only my opinion, make of it what you wish. What does this mean? It means it's not advice nor recommendation to either buy or sell anything! It's only meant for use as informative or entertainment purposes.
Since the last post , the candlestick chart has continued on its upwards move.
On the 26th April will the candles break through the resistence line or follow the Elliot Combo wave and head towards X,
The RSI chart is indicating a slow down in the momentum with the momentum heading back to the 75% line on the RSI chart

A Bullish market is driving sentiment, Elliot wave formation is in full swing. We have seen 11 days of continuous upside , the candlestick formation is playing out Elliot wave theory.
(https://elliottwave-forecast.com/elliott-wave-theory/)
we are seeing cup and saucer formations on the chart https://www.investopedia.com/university/charts/charts3.asp
and indicator of price movement , on this current chart we should see a flattening of the current price moving into another elliot wave extension
18th May, since my last post 11 days on the LTC charts are showing the price bouncing between the 23% and 50% band on the Fin chart.
When evaluating the Fib chart I set the criteria at 16th Dec 2017 candlestick and expanded the lookahead day out to the 6th July , to complete the triangle of the Fib retracement,
I have then over layed curved graphics indicating the pattern proposal.
The pattern proposal is demonstrating a bounce from around the €110 low to a hi which is bouncing off the Hypotenuses of the Fib retracement triangle
()
The Indicators for movement are
RSI is holding at the critical 40%ish - not a strong buy signal
SRSI , while bouncing at the lower end and below the critical 20% is an indicator of a Buy signal on its own
The Candlestick is bouncing off €110 support line with a current resistance of around €130.
So the question is when is a good time to buy.
For me its a weak Buy at the €111 price with the next resistance at €130 as has been for the past 3 weeks,
Over the coming cycle ( next 1 week ) there is a possibility of a breakout above the 130 line , if this does not happen the chart will possibly follow the current predicted lines ( shown in black)
Litecoin on the move from it low,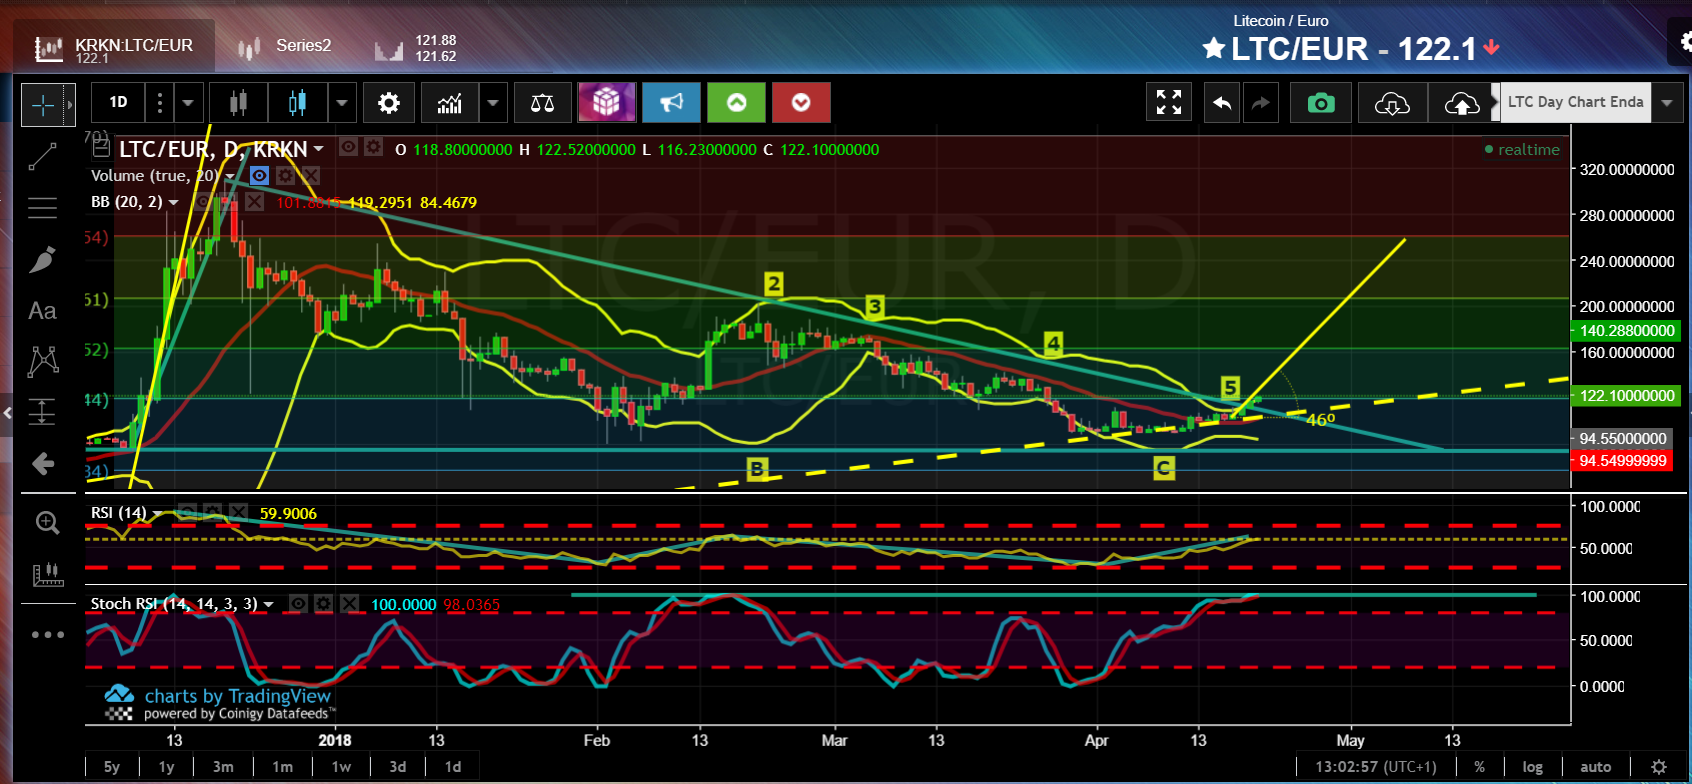
Charts are showing a nice trend,
In the near future there is a positive indicator of a pull back from the values on the 20th of April 2018,
From the Fib overlay on the Elliot wave a resistance in the €124 to 127 range for the 20th 21st April
Legal Disclaimer: I am not a financial advisor nor is any content in this article presented as financial advice. The information provided in this blog post and any other posts that I make and any accompanying material is for informational purposes only. It should not be considered financial or investment advice of any kind. One should consult with a financial or investment professional to determine what may be best for your individual needs. Plain English: This is only my opinion, make of it what you wish. What does this mean? It means it's not advice nor recommendation to either buy or sell anything! It's only meant for use as informative or entertainment purposes.
As predicted from the analysis on the 20th April, the Charts are showing a change in direction, the price hit a predicted high of between €124 and €127 actual was €128 before retreating back to a day low of €114 and then settling back into the €119- €123 range .
According to the Elliot wave formation this occurrance was in wave 3 to 4, thus suggesting that we are in for another movement in the upwards direction over the coming cycle
On the RSI indicator , the trend line tested the 64% resistance line( black line) and retreated from this significant indicator, suggesting momentum shift from the market.
![SRSI21stApril2018.PNG]
How this all looks on the Candle stick chart for LTC
![Candle21stApril2018.PNG]
What do the charts hold for the future ,
25th April a potential €140 range with support line of €128
Any directional change negatively will be driven by Market forces (FUD)
Legal Disclaimer: I am not a financial advisor nor is any content in this article presented as financial advice. The information provided in this blog post and any other posts that I make and any accompanying material is for informational purposes only. It should not be considered financial or investment advice of any kind. One should consult with a financial or investment professional to determine what may be best for your individual needs. Plain English: This is only my opinion, make of it what you wish. What does this mean? It means it's not advice nor recommendation to either buy or sell anything! It's only meant for use as informative or entertainment purposes.
( )
)
Since the last post , the candlestick chart has continued on its upwards move.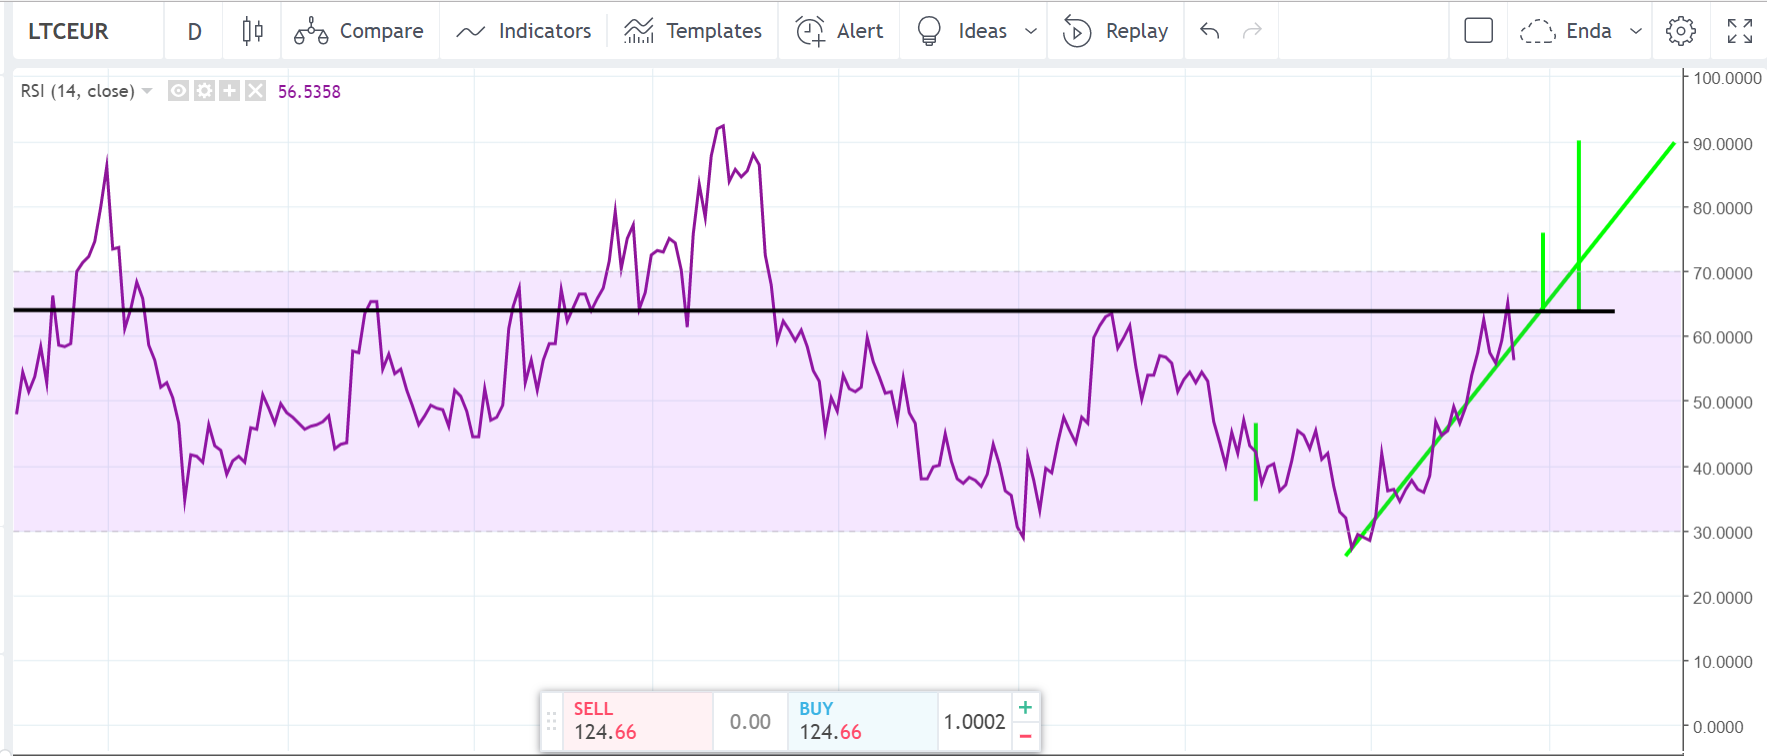
On the 26th April will the candles break through the resistence line or follow the Elliot Combo wave and head towards X,
The RSI chart is indicating a slow down in the momentum with the momentum heading back to the 75% line on the RSI chart
 :
Click on any badge to view your own Board of Honor on SteemitBoard.
For more information about SteemitBoard, click here
If you no longer want to receive notifications, reply to this comment with the word
STOP(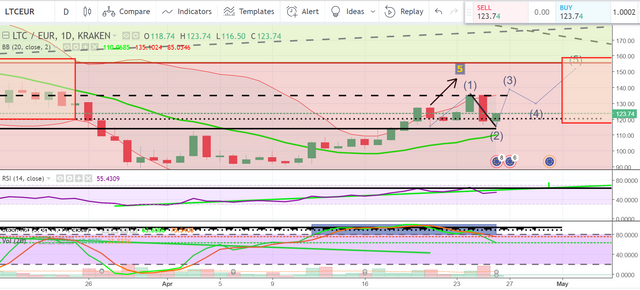 )
)
We have a mixed signal for the 26th April, a trailing hammer
for the RSI the momentum has turned positive once again. We are looking to see it move above the 75% mark once again but that may not happen in the next couple of days on the day chart. The Stoachastic RSI is moving in the wrong direction. We want to see the Green line trailing Red line , which it not currently doing.
We will possibly see a saucer effect over the coming days mirroring the last 7 days .
Remaining flat the next couple of days and then a gradual positive move up
Legal Disclaimer: I am not a financial advisor nor is any content in this article presented as financial advice. The information provided in this blog post and any other posts that I make and any accompanying material is for informational purposes only. It should not be considered financial or investment advice of any kind. One should consult with a financial or investment professional to determine what may be best for your individual needs. Plain English: This is only my opinion, make of it what you wish. What does this mean? It means it's not advice nor recommendation to either buy or sell anything! It's only meant for use as informative or entertainment purposes.
Update 7th May 2018 - LTC.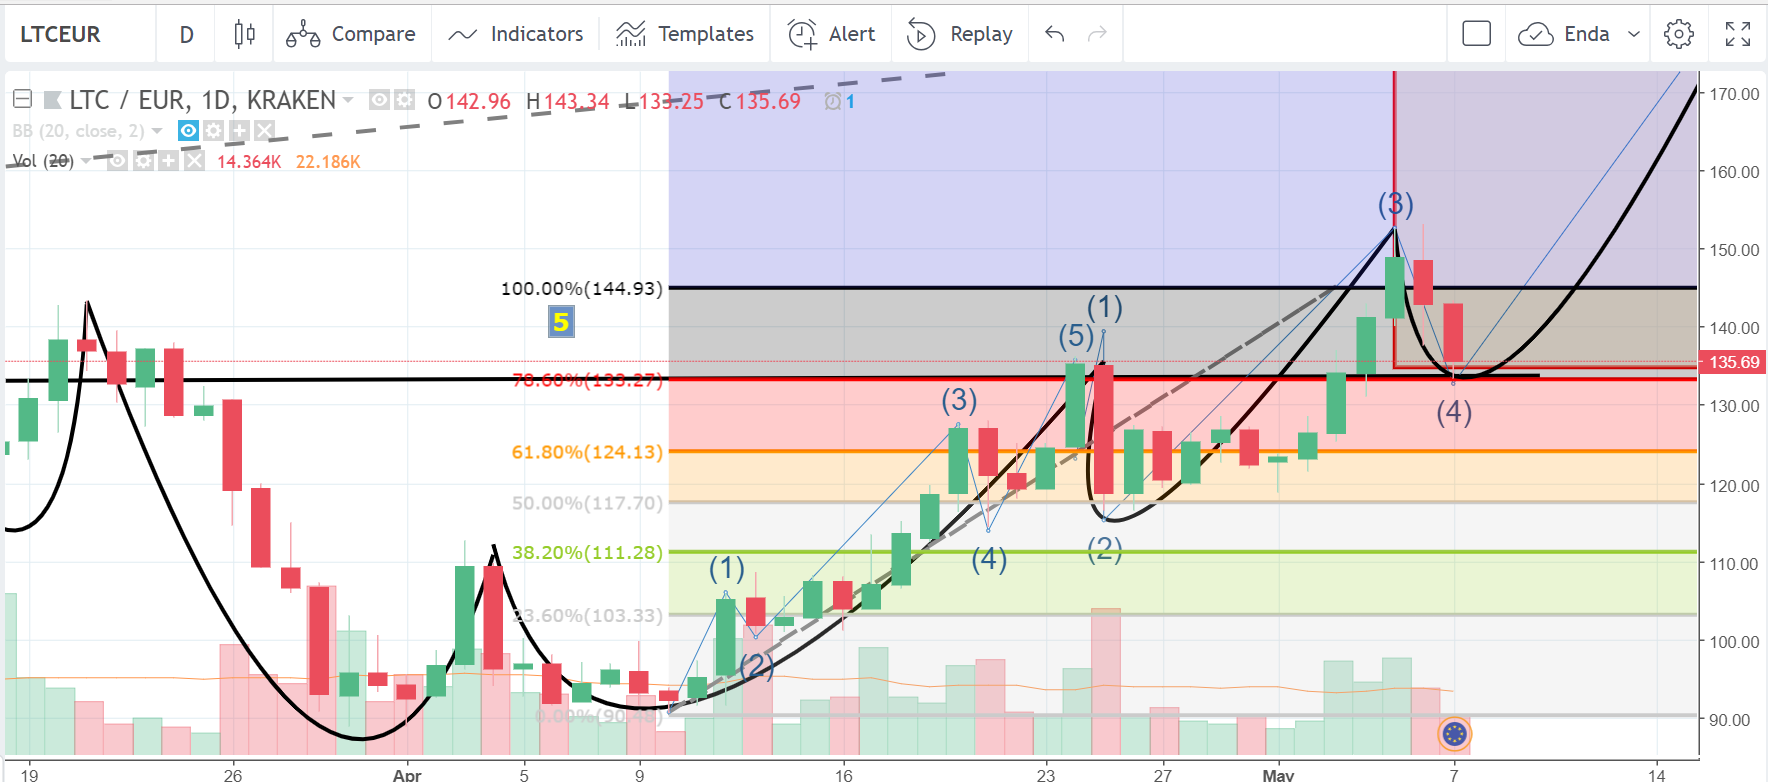 )
)
(
A Bullish market is driving sentiment, Elliot wave formation is in full swing. We have seen 11 days of continuous upside , the candlestick formation is playing out Elliot wave theory.
(https://elliottwave-forecast.com/elliott-wave-theory/)
we are seeing cup and saucer formations on the chart
https://www.investopedia.com/university/charts/charts3.asp
and indicator of price movement , on this current chart we should see a flattening of the current price moving into another elliot wave extension
18th May, since my last post 11 days on the LTC charts are showing the price bouncing between the 23% and 50% band on the Fin chart. )
)
When evaluating the Fib chart I set the criteria at 16th Dec 2017 candlestick and expanded the lookahead day out to the 6th July , to complete the triangle of the Fib retracement,
I have then over layed curved graphics indicating the pattern proposal.
The pattern proposal is demonstrating a bounce from around the €110 low to a hi which is bouncing off the Hypotenuses of the Fib retracement triangle
(
The Indicators for movement are
RSI is holding at the critical 40%ish - not a strong buy signal
SRSI , while bouncing at the lower end and below the critical 20% is an indicator of a Buy signal on its own
The Candlestick is bouncing off €110 support line with a current resistance of around €130.
So the question is when is a good time to buy.
For me its a weak Buy at the €111 price with the next resistance at €130 as has been for the past 3 weeks,
Over the coming cycle ( next 1 week ) there is a possibility of a breakout above the 130 line , if this does not happen the chart will possibly follow the current predicted lines ( shown in black)
( )
)
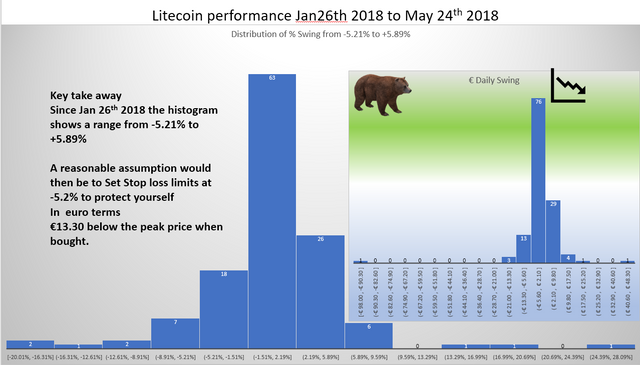
Interesting statistic thrown up when analysed
data from the 26th jan2018 to may 24th 2018 inclusive
Congratulations @enda.keane! You received a personal award!
Click here to view your Board
Do not miss the last post from @steemitboard:
Congratulations @enda.keane! You received a personal award!
You can view your badges on your Steem Board and compare to others on the Steem Ranking
Vote for @Steemitboard as a witness to get one more award and increased upvotes!