18th May, since my last post 11 days on the LTC charts are showing the price bouncing between the 23% and 50% band on the Fin chart.
When evaluating the Fib chart I set the criteria at 16th Dec 2017 candlestick and expanded the lookahead day out to the 6th July , to complete the triangle of the Fib retracement,
I have then over layed curved graphics indicating the pattern proposal.
The pattern proposal is demonstrating a bounce from around the €110 low to a hi which is bouncing off the Hypotenuses of the Fib retracement triangle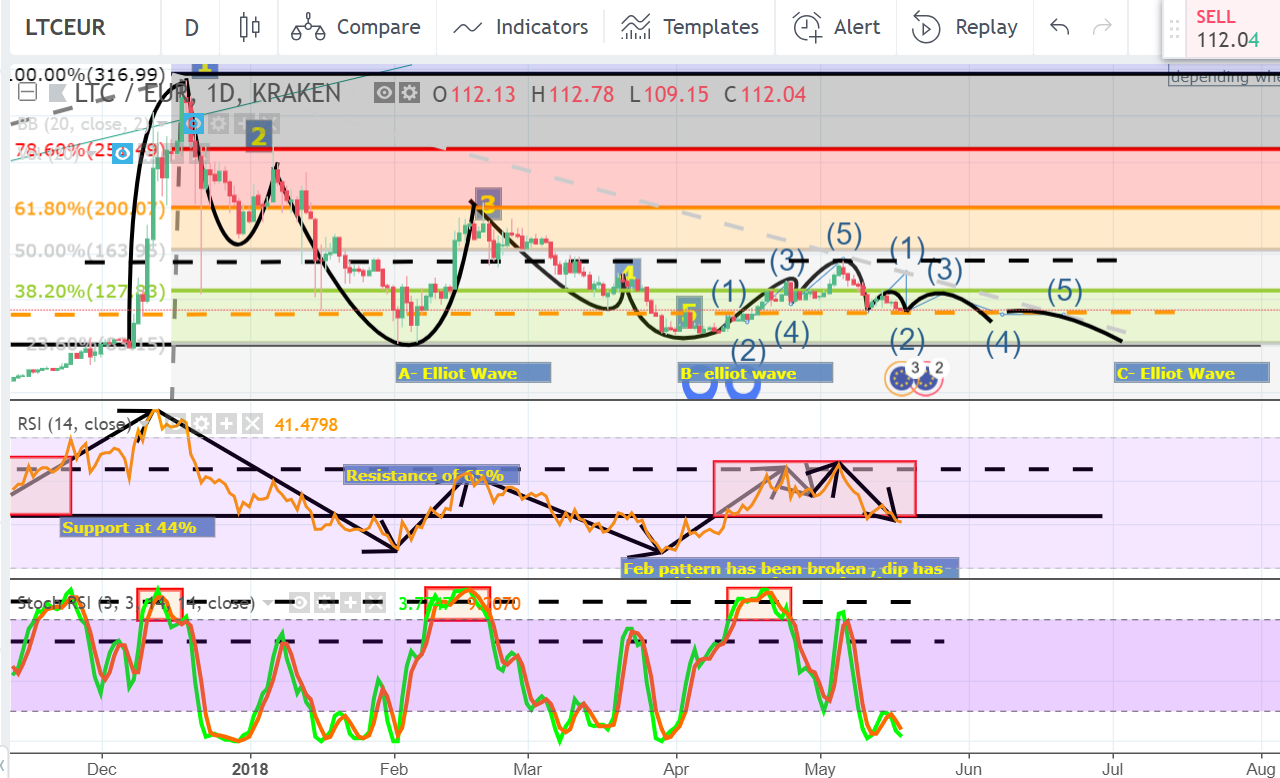
The Indicators for movement are
RSI is holding at the critical 40%ish - not a strong buy signal
SRSI , while bouncing at the lower end and below the critical 20% is an indicator of a Buy signal on its own
The Candlestick is bouncing off €110 support line with a current resistance of around €130.
So the question is when is a good time to buy.
For me its a weak Buy at the €111 price with the next resistance at €130 as has been for the past 3 weeks,
Over the coming cycle ( next 1 week ) there is a possibility of a breakout above the 130 line , if this does not happen the chart will possibly follow the current predicted lines ( shown in black)