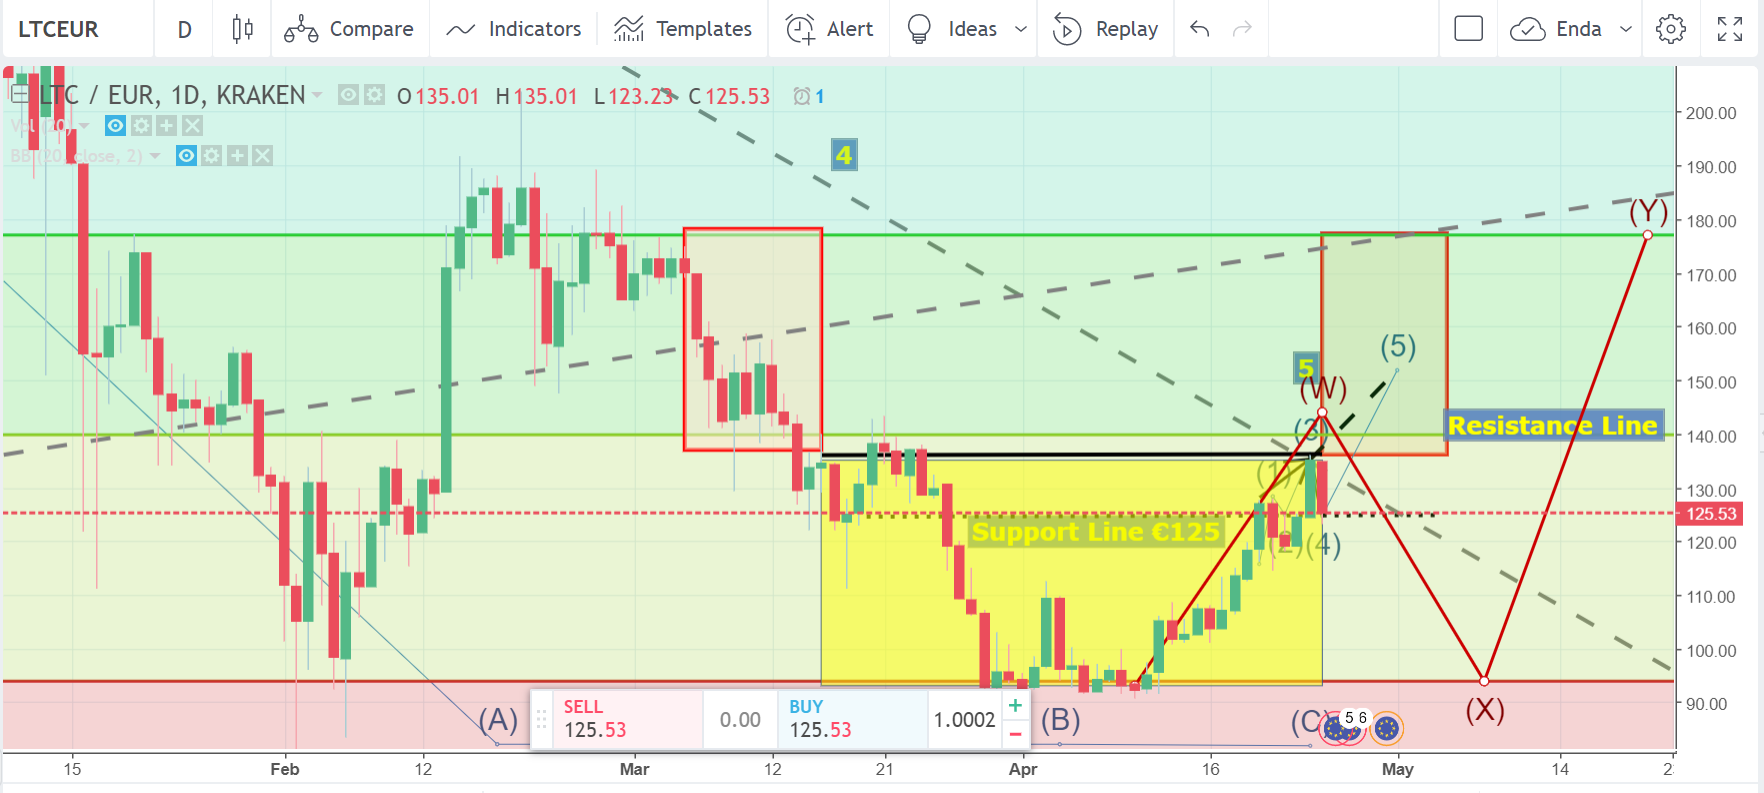
Since the last post , the candlestick chart has continued on its upwards move.
On the 26th April will the candles break through the resistence line or follow the Elliot Combo wave and head towards X,
The RSI chart is indicating a slow down in the momentum with the momentum heading back to the 75% line on the RSI chart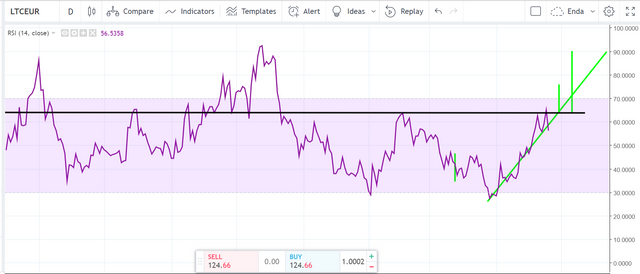
I am predicting another red candlestick for the 25th April