Intro to Chaikin Money Flow
Developed by Marc Chaikin
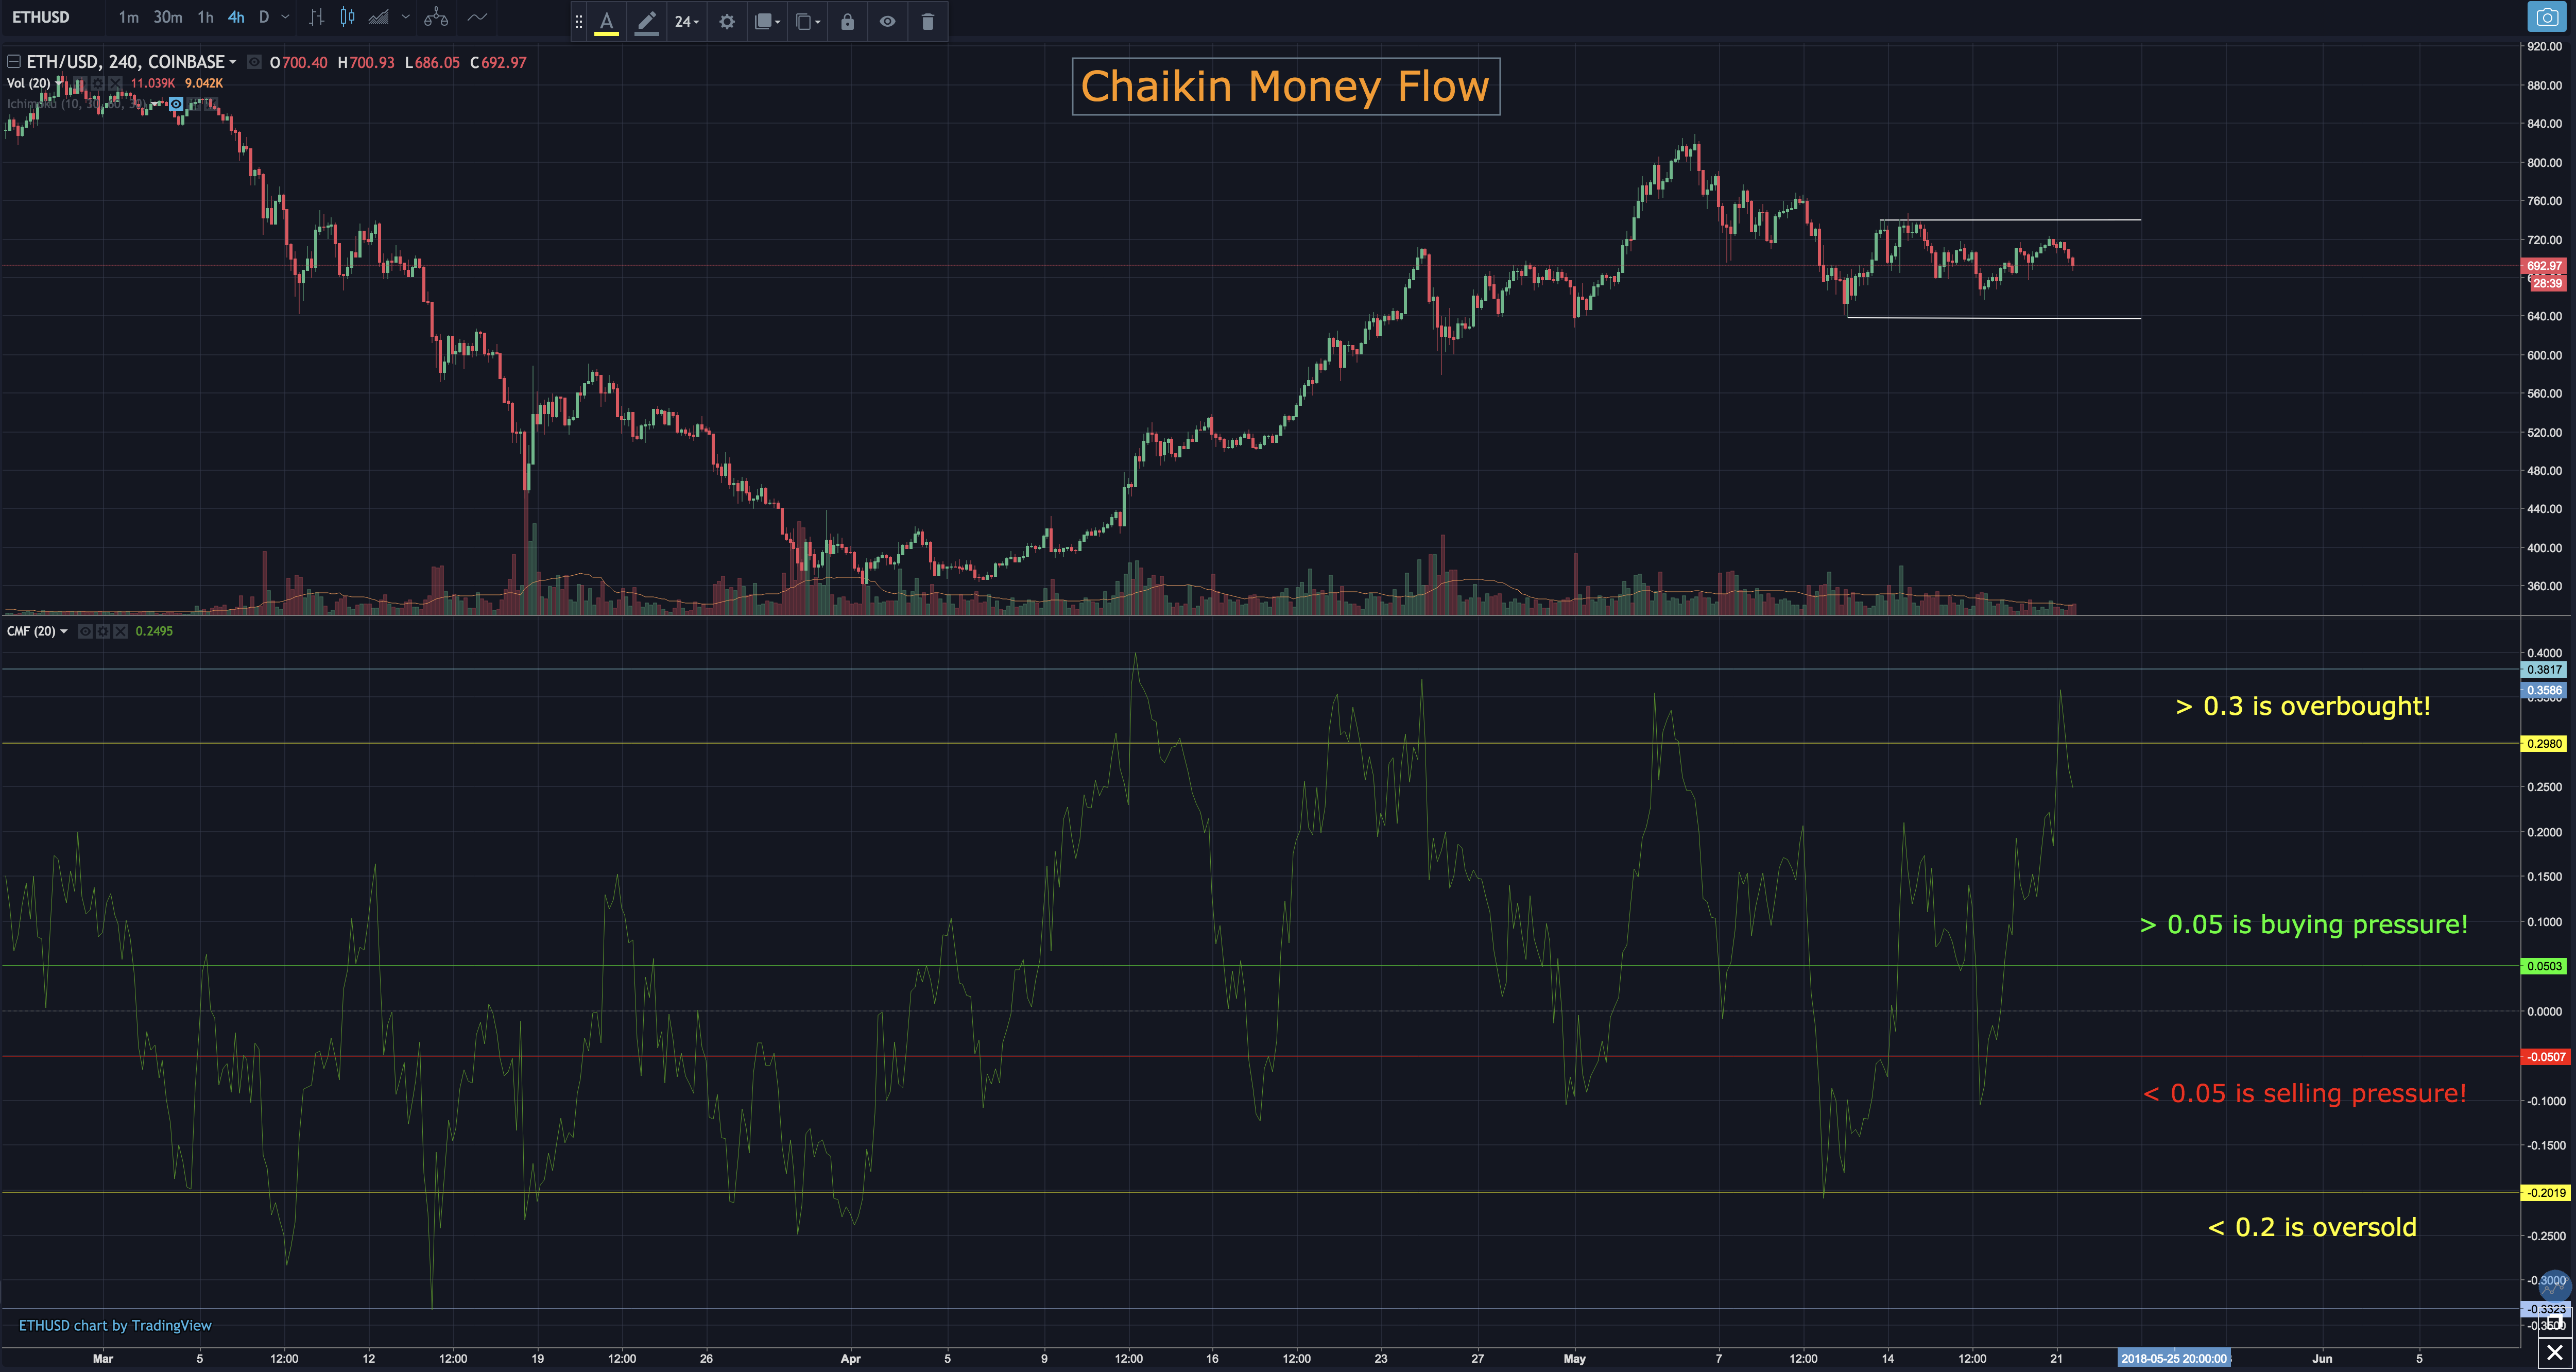
An oscillator that measures buying and selling pressure over a set period of time.
A move into the positive territory indicates buying pressure
Forms basis for accumulation/distribution line
Sums money flow volume for a specific look back period - typically 20 or 21 days
Oscillates above and below 0 line
Generally stays in between -0.5 and 0.5
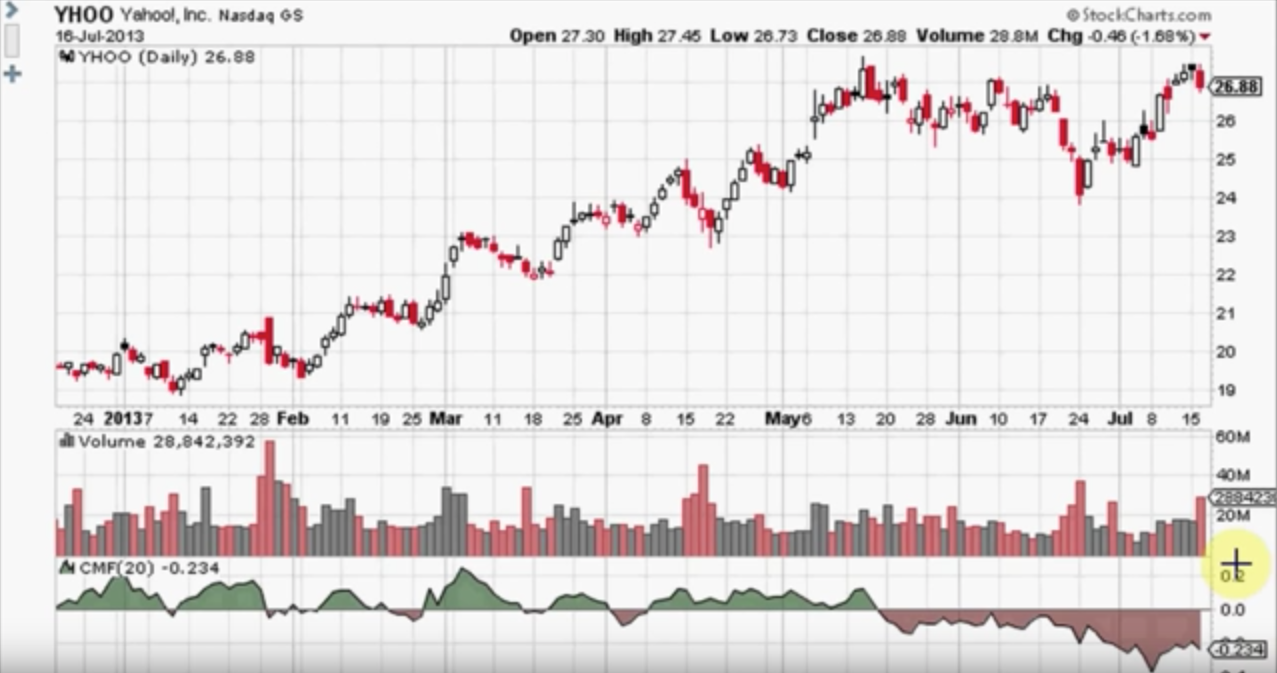
Can be used to confirm or question the strength behind an uptrend. Positive would confirm, negative would question.
Can be used to quickly define buying or selling bias
Can get whipsawed with false signal. Setting to +0.05/-0.05 can help.
Can be useless after gap in price. EX: price gaps down but closes at the high of the candle.
Calculation
- Calculate the money flow multiplier for each period
- Multiply this value by the period’s volume to find money flow volume
- Sum money flow volume for the 20 periods
- Divide by the 20 period sum of volume
Money Flow Multiplier = [(Close - Low) - (High - Close)] / (High - Low)
-Is positive when the close is in the upper half of the periods high-low range and negative when in the lower half.
-Equals 1 when the close is equal to the high and -1 when equal to the low
Money Flow Volume = Money Flow Multiplier x Volume for the Period
20-period CMF = 20-period Sum of Money Flow Volume / 20 period Sum of Volume
-Rarely reaches extremes
-Would need 20 consecutive closes on the high or low to reach 1/-1
-Typically oscillate between -0.5 and +0.5
Can be very useful when in an accumulation/distribution zone. If selling pressure while price ranges or rises then it is likely to be distribution.
Accumulation Distribution Line (ADL)
Developed by Marc Chaikin
Is a volume based indicator designed to measure the cumulative flow of money into and out of a security.
A running total of each period’s Money Flow Volume
Multiplier is calculated based on the relationship of the close with the high/low range.
Money flow multiplier is multiplied by the period’s volume to come up with a Money Flow Volume.
Running total of Money Flow Volume forms the Accumulation Distribution Line.
Can be used to confirm trend or anticipate reversals with divergences.
Calculation
- Calculate the Money Flow Multiplier.
- Multiply this value by the volume to find Money Flow Volume
- Create running total of Money Flow Volume to form the ADL
Money Flow Multiplier = [(Close - Low) - (High - Close)] / (High - Low)
Money Flow Volume = Money Flow Multiplier X Volume for the Period
ADL = Previous ADL + Current period’s money flow volume
Volume is in effect reduced unless the Money Flow Multiplier is at extremes
-If money flow multiplier is 0.5 then half of volume translates into money flow volume
A high positive multiplier combined with high volume shows strong buying pressure.
Sources:
- http://stockcharts.com/school/doku.php?id=chart_school:technical_indicators:chaikin_money_flow_cmf
- http://stockcharts.com/school/doku.php?id=chart_school:technical_indicators:accumulation_distribution_line
- youtube.com/watch?v=rQq4xbJUmrA
Comment if you have something to say. Smash the like if this was helpful and definitely finger that follow!
Want more?
Intro to Ichimoku Clouds
Bill Williams Fractals
@CarpeNoctom's Top 5 Indicators
Check out the Brand New Projections for the Bitcoin 2018 Bull Trend - $34,000 Target?!?!
Click here for the 0.1 > 1 BTC Trading Challenge!
Here the BTC:USD 4 hour chart DAILY UPDATE!
And you definitely don’t want to miss the next Gold Bubble!
White Paper Cliff Notes


Coins mentioned in post: