Analyzing WLDUSDT using Support and Trendline Strategies
Greetings my fellow Steemians and crypto enthusiasts it is another day to analyze the crypto market and today I have decided to work on the WLDUSDT pair on a 4H timeframe.
If you have been following the market closely, you will notice that all crypto has been bearish for about a week or more now. Based on that notion, I stumbled into the WLDUSDT pair and decided to make a little analysis of it.
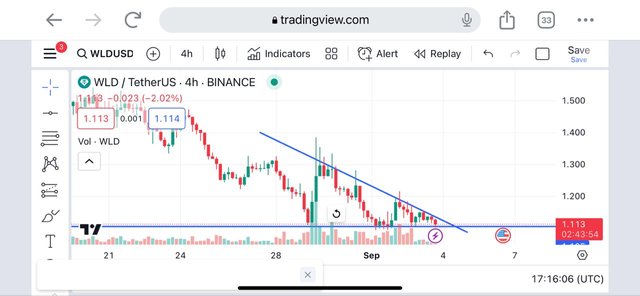
I have shared with us previously how to trade support and resistance levels effectively and this is no different. From the chart above, you will notice a descending triangle has been formed and that was formed with the help of the support level and the trendline.
Trading such a structure is very simple. I have always told you that I trade trends and I also trade structure since often they repeat themselves. In this case, the level of support was tested many times if checked from the lower time frame.
Testing this level multiple times means it is a key support level and that means the level may likely not be broken. It is possible to break it but it all depends on the market momentum. For that reason, I concluded that there are 2 possible movements in the market.
I was set to enter the market after the break of the support level to sell the market and alternatively, I was also ready to buy the market immediately after the trendline was broken. As a low, once such a trendline is broken, the price is expected to go upward.
So I kept myself ready for any possible movement in the market. One of the main reasons I enjoy crypto trading is that you can market your gain on both sides i.e. if the price is falling or the price is rising. This is the reason why the market presents us with two possible positions in the chart above.
So in summary, we all can trade support and a trendline together which we refer to as the descending triangle format. You can see clearly that the chart looks like a triangle and that is a possible movement that is likely to take place in the market at that point.
You can also trade the resistance and the trendline which are also ascending triangles. The possibilities in these charts are the same and that pattern can be traded equally. I wish to share with you all the results of these patterns after the breakout so that you will see a good profit generated on these movements.
Disclaimer: This post is made as an education and not investment advice. Digital asset prices are subject to change. All forms of crypto investment have a high risk. I am not a financial advisor, before jumping to any conclusions in this matter please do your research and consult a financial advisor.
@tipu curate
Upvoted 👌 (Mana: 7/8) Get profit votes with @tipU :)
Upvoted! Thank you for supporting witness @jswit.
Analyzing WLDUSDT using Support and Trendline Strategies shared a very nice topic. I enjoyed reading your post.
Great to know! Thanks brother. I think very soon we will see a good pump.
Analyzing WLDUSDT using Support and Trendline Strategies is a great content.