Analyzing BTCUSDT using the double bottom Strategies
Hello friends, it's another wonderful day in the crypto world and I'm delighted to be here with you all once again. I have always shared with you a strategy to win the market and today I'm going to be showing you another analysis and the results obtained so far.
I have discussed with us initially about the double bottom strategies in my previous post here in this community so if you missed out on that and wish to have more insight on it, I recommend you do well to read through the post on my blog.
For recall purposes, I will be given a brief overview of what we termed as a double bottom once again. In trading the crypto market, we are always advised to trade patterns because it is always 90% efficient.
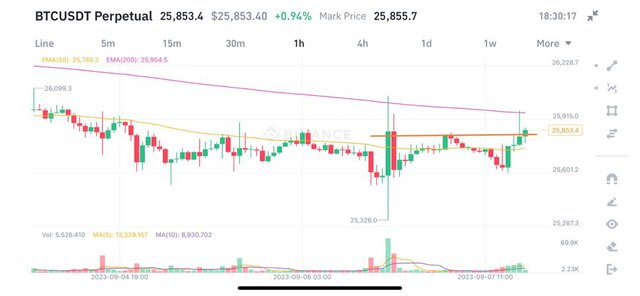
Whenever we notice a double bottom on a chart like the one above in the chart, We will prepare to long the market because history has proven that anytime we encounter a double bottom, the next thing that follows is that the market will pump.
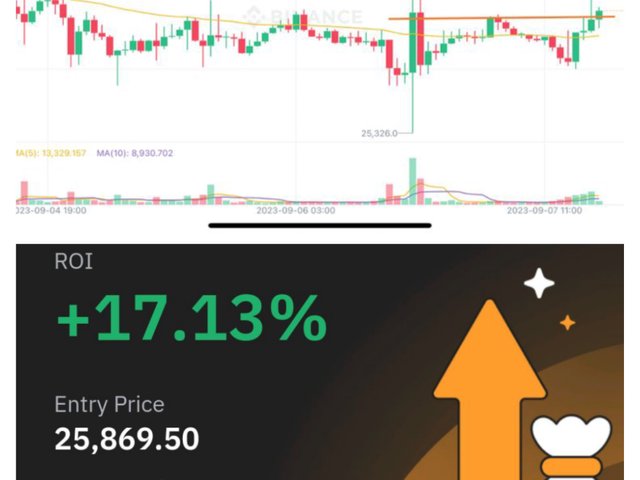
Seeing this pattern on the chart, I drew the neckline as you can see in the charge then I waited for the closure of the 15M candle and the neckline which I had drawn to enter the market. I have always told us to analyse the market using a higher timeframe and then use a lower timeframe to enter the market.
In this case, I analyzed the market using the 1H timeframe. From the chart above you can see the parameters which gave me a clear indication to enter the market. I saw a double-bottom well formed in the 1H timeframe then I also saw the price breaking the neckline I drew on the chart.
Sometimes you may need all the confirmation to enter into the market. I entered the market using the 15M timeframe after the closure of the candle that broke the neckline I drew on the chart.
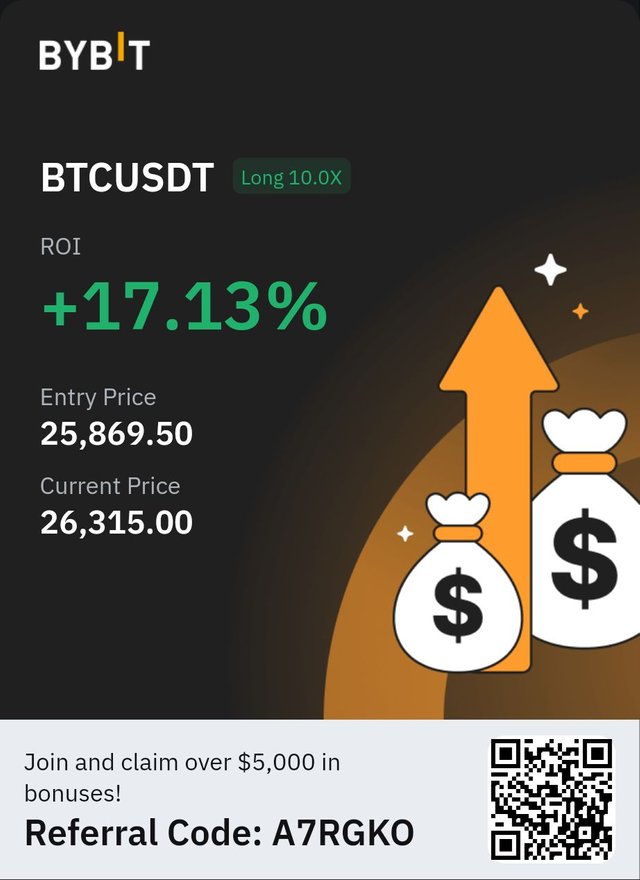
I also used a proper risk-reward ratio to ensure I stayed longer in the market because the market has been very volatile these past few days. From the above image, you will notice I used a leverage of 10x and I was also willing to lose just about $0.7 of my capital.
I always advise traders to use a proper risk-reward ratio. The risk-reward of this trade was 2:10 and since I analyzed the market so well I got out with my profit. I hardly make losses these days because of the leverage I use in my trade. I stay longer in the market as well.
In summary, trading the crypto market using the chart pattern is very profitable most times because the market repeats the same pattern every time. To trade the financial market, you need to kill your emotions, kill your greed and kill your fear. Only then can you be able to trade the financial market properly.
I wish to see traders identify the double bottom pattern on a chart and possibly trade it as we progress in this journey. If you have any questions or contributions, please do well to ask me in the comment section of this post. We will meet again to continue trading in my next post.
Disclaimer: This post is made as an education and not investment advice. Digital asset prices are subject to change. All forms of crypto investment have a high risk. I am not a financial advisor, before jumping to any conclusions in this matter please do your research and consult a financial advisor.


Upvoted! Thank you for supporting witness @jswit.
@tipu curate
;) Holisss...
--
This is a manual curation from the @tipU Curation Project.
Upvoted 👌 (Mana: 0/7) Get profit votes with @tipU :)
This is so great to see your support in this post. Keep going with support.
Analyzing BTCUSDT using the double bottom Strategies is a great content.
You shared something very important today. Nice to know through your post.