Topdown Analysis Of BTCUSDT Using Support And Resistance Strategy And RSI Indicator As A Confluence
Hello great minds,
It is a great opportunity to appear before you all today to share my analysis on bitcoin.
I believe you are all doing perfectly fine and are enjoying your activities in the community as you actively share in steemit promotion across various social media platform.
Bitcoin as we know it, is the father of all other cryptocurrency and it is worth carrying an analysis on, since it is the driver of all other cryptocurrency in the cryptospace.
Today, I will sharing my analysis of btcusdt and I will be beginning from the monthly timeframe.
ANALYSIS USING SUPPORT AND RESISTANCE STRATEGY
My analysis often begin from the higher timeframe and it moves to the lower timeframe.
On the higher timeframe like the monthly timeframe, I identify market trends, and on other timeframe I search for key market levels and also search for entries into the market.
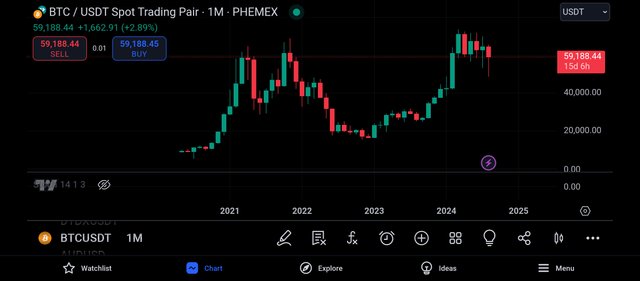
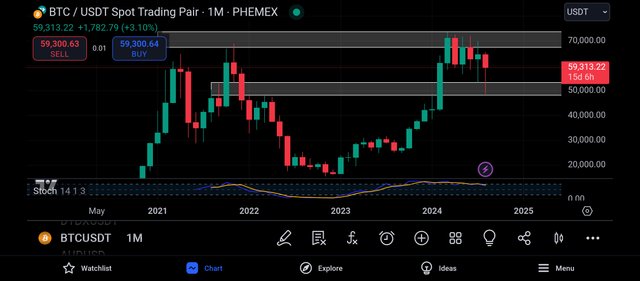
The above screenshot is that of btcusdt on the monthly timeframe as we can all confirm.
And from the above screenshot, we can see that there are less candles on this timeframe, and this is because each candle formed on this timeframe takes an activity period of one month.
Also on this timeframe, we can notice that the market trend is easily identified, and from the screenshot above, we can see that Bitcoin market is bullish overall.
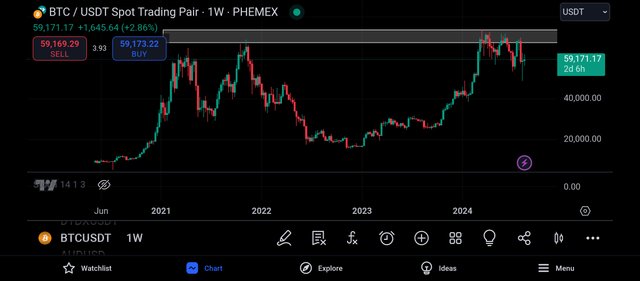
And getting to the weekly timeframe, I could see the market more clearly, I could see more candlestick and this is because each candle on this timeframe is formed within the time period of 7days.
And looking carefully, I was able to identify a key level, and this level is functioning as a resistance level to the market price, and it is expected for the market to be rejected when it trades towards this resistance level.
And from the above screenshot, we can see bearish rejection from this level, as the buying pressure is not strong enough to drive the market upwards.
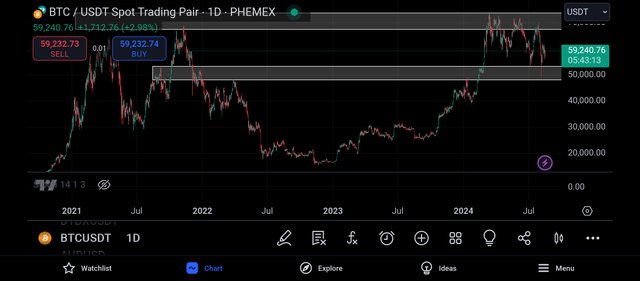
I then moved to the daily timeframe for more market information and on this timeframe, I could see the market more clearly.
I could see the presence of the buyers and sellers in the market as they struggle to drive the market to their preferred direction.
And then I was able to identify another key level and this level is functioning as a support level to the market price, and when the market trades towards this level we can expect to see a bullish rejection candle.
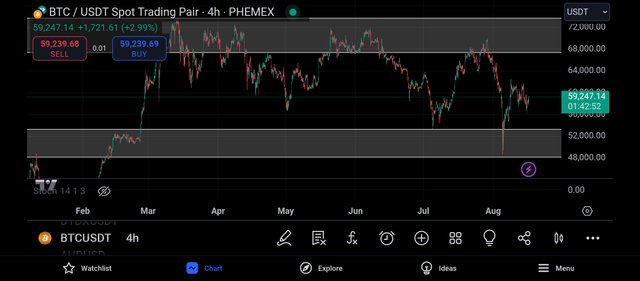
On the 4hr timeframe, I realised that the market has been rejected from this level after trading towards this support level.
And on this timeframe, there are lots of manipulation that we need to be careful before entering the market, and looking carefully, I noticed that the market is about to retrace towards this support level.
And when the market traces to this support level, I can expect to take a buy but before then, I decided to continue on the 2hr timeframe.
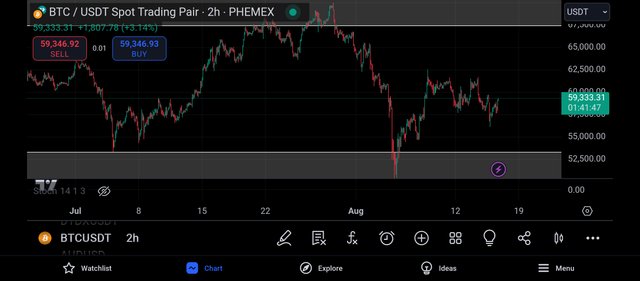
And on the 2hr timeframe, I could see the market more clearly although it has become very noisy at this level.
And looking carefully, I realised that the market Is retracing downward to my support level and when it does, I can take my long position but before then, I decided to search for trading confluence using the relative strength index indicator.
CONFLUENCE USING RELATIVE STRENGTH INDEX INDICATOR
The relative strength index indicator is an indicator that helps to identify overbought and oversold market.
When a market is spotted to be overbought, it is a bearish trend reversal signal and when it is oversold, it is a bullish trend reversal signal.
An overbought market can be spotted when the rsi crosses above the 80% line and an oversold market is detected when the market crosses below the 20% line.
Going to the monthly timeframe, I noticed that the market is being overbought after applying the rsi indicator.
And this is because the rsi indicator has crossed above it's 80% line, and this an indication that the market is about to encounter a bearish move.
An overbought market often signals a bearish trend reversal of the market, that is, a change in market strength from the buyers to the sellers.
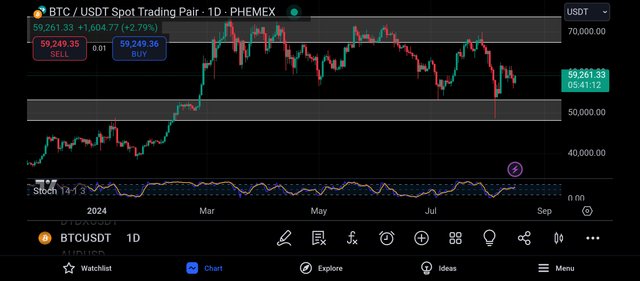
Getting to the daily timeframe, I noticed that the market is being overbought, although the rsi has not crossed above its 80% line, but it is moving towards its 80% line.
And when it approaches it's 80% line, the market can be said to be overbought, and an overbought market signals a bearish trend reversal of the market.
And as such, I decided to search for my entry on the 2hr timeframe.
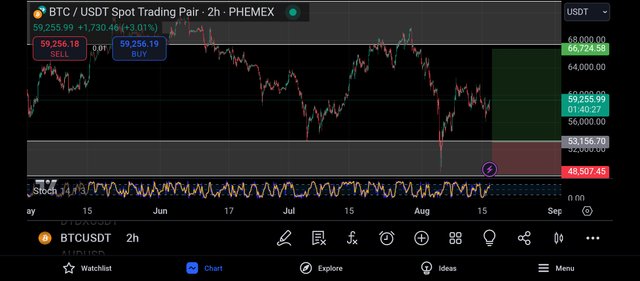
Getting to the 2hr timeframe, I noticed that the market has not traded into my poi, which is my support level, and as such I decided to be patient.
I then placed my entry on that support level with the expectation that the market will move towards this level, and my take profit was placed on the closest resistance level to the market price.
CONCLUSION
Bitcoin is the father of all cryptocurrency and it is the driver of all other altcoins in the cryptomarket.
I have shared my analysis on the market and I expect to see a momentary bearish move.
https://x.com/JuecoYoung/status/1824556163356127733
@tipu curate
Upvoted 👌 (Mana: 3/5) Get profit votes with @tipU :)
Upvoted! Thank you for supporting witness @jswit.