Topdown Analysis Of AVAXUSDT Using Support And Resistance Strategy And RSI Indicator As Confluence
Hello great minds,
I feel honored to approach you all today to discuss on a very important issue in the cryptospace.
I believe you are all doing perfectly fine and are enjoying your activities in the community as you actively promote steemit across various social media platform.
Today I will be sharing my analysis on the token of avalanche network which is avax, and I will be sharing my analysis on avax against usdt.
Please stay tuned as I share my analysis
ANALYSIS USING SUPPORT AND RESISTANCE STRATEGY
Technical analysis are best started from the higher timeframe and then to the lower timeframe.
Some analyst prefer starting their analysis from the daily timeframe, down to the fewer minutes, but I begin mine from the monthly timeframe.
The monthly timeframe helps me to compress market activities and display them on a screen.
And the monthly timeframe also helps in eliminating unnecessary noise from the market.
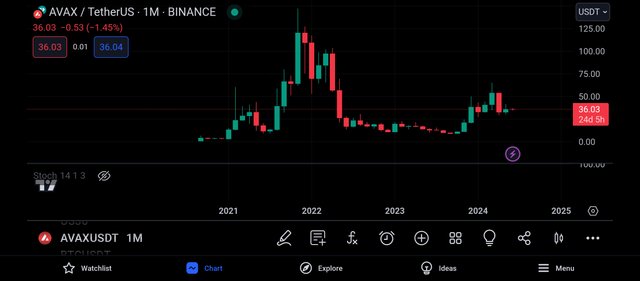
Beginning with the monthly timeframe of the pair AVAXUSDT, we can see the formation of bullish and bearish candles.
We can also see that there are few candles on this timeframe and this is because each candlestick were formed within the space of 1month.
Also from the above screenshot, we can notice that it is easier for the market trend to be identified, and from the above screenshot we see that the most recent leg of the market is bullish.
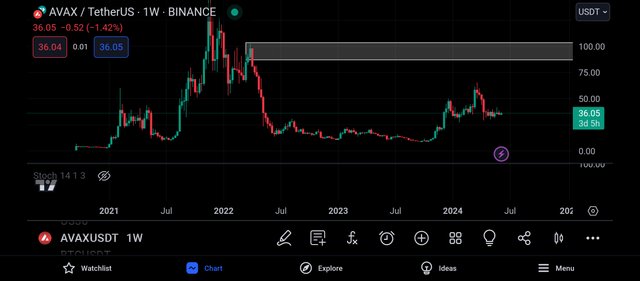
I then moved to the weekly timeframe for more market analysis, and on this timeframe I could see more market activities.
I could see the buyers and sellers battling to push price to their preferred direction.
And also on this timeframe, I spotted a key level and this level is functioning as a resistance level to the market price and it is expected for the market to be rejected when it gets to this level.
And we can see that the buyers are doing their possible best to push the market towards this resistance level and from there, we can take a sell off the market.
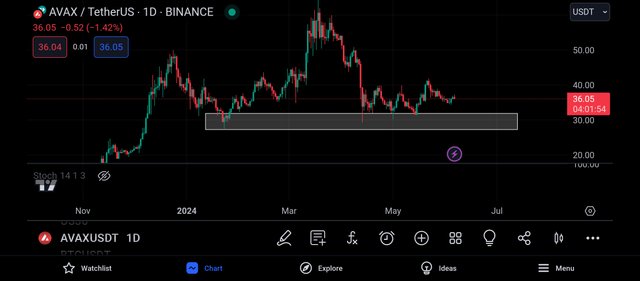
I then continued on the daily timeframe and on this timeframe, I could see lots of market activities.
I could feel the presence of the buyers and sellers in the market as they try to dominate the market which often results to market manipulation.
Looking carefully at the market, I was able to spot another key level and this level is functioning as a support level to the market price.
And it is expected for the market to be rejected when it trades towards this level.
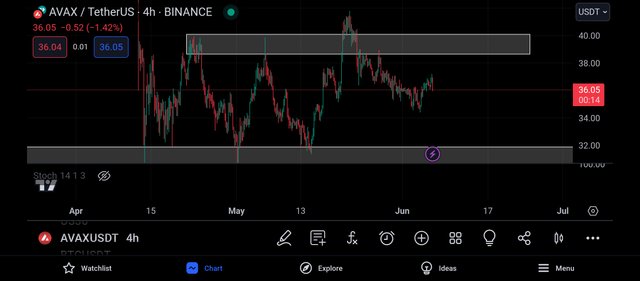
Then I continued on the 4hr timeframe and on this timeframe I could see series of market activities.
And here, I was able to spot another level and this level is functioning as a resistance level, indicating the presence of selling pressure in the market.
And with this analysis, my bearish bias became strengthened and I expect to see the market embark on a bearish move.
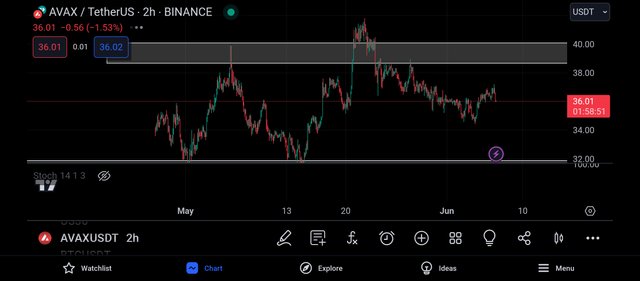
It is on the 2hr timeframe that I take my entry into the market, and on this timeframe, I could see the information on the 4hr more clearly.
And as such, I decided to short the market but before then, I decided to make use of rsi indicator as a confluence to my trade.
CONFLUENCE USING RELATIVE STRENGTH INDEX INDICATOR
The rsi Indicator is a very important trading tool in the cryptomarket.
The rsi indicator is used to spot oversold and overbought market regions.
And when a market is spotted to be oversold, it is a signal that the market is about to experience a bullish move.
And when a market is spotted to be overbought, it is a signal that the market is about to experience a bearish move.
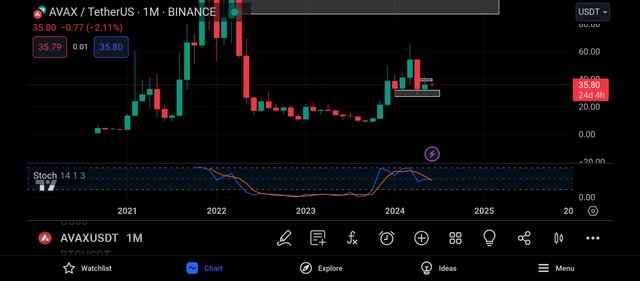
Applying the rsi to the monthly timeframe, I noticed that the rsi has gotten to its 80% line and this is an indication that the market is being overbought.
An overbought market is one that Indicates a bearish trend reversal, that is, a market that shows the change in strength from the bulls to the bears.
This implies that we expect to see a momentary bearish move from the market.
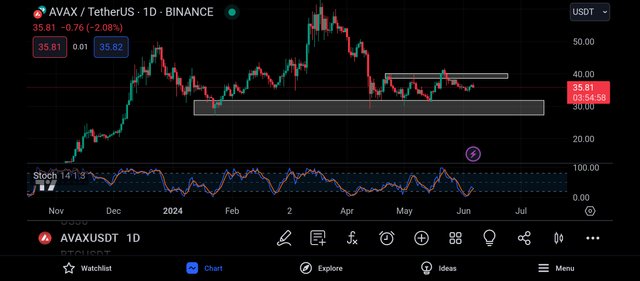
Applying the rsi to the daily timeframe, I noticed that the market is being oversold as the rsi has crossed below its 20% line.
This can also be seen as a bullish trend reversal signal to the market, as the bulls are expected to take control over the market.
Then I moved to the 2hr timeframe In search of entry into the market.
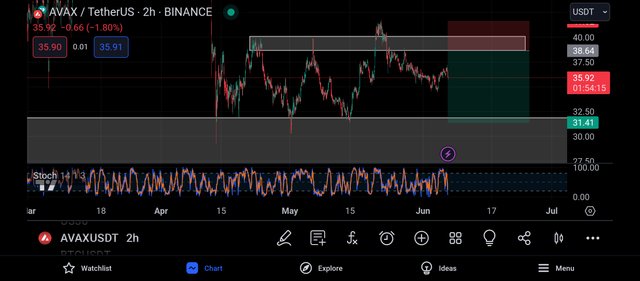
Getting to the 2hr timeframe, I noticed that the rsi is on its 20% line, and this is an indication that the market will experience a momentary bullish move.
And according to my analysis, I expect the market to retrace upward to its resistance level before being rejected properly.
And as such, I placed my sell order on the market closest resistance level and my take profit was placed on the market closest support level.
CONCLUSION
Avalanche is a very nice crypto project in the cryptospace and its native token is what we know to be avax.
And as seen above, I have shared my analysis on AVAXUSDT, and I intend for my post to be taken as an educational content and not a financial advise.
https://x.com/JuecoYoung/status/1798829105774727430
Upvoted! Thank you for supporting witness @jswit.
💯⚜2️⃣0️⃣2️⃣4️⃣ This is a manual curation from the @tipu Curation Project.
Also your post was promoted on 🧵"X"🧵 by the account josluds
@tipu curate
Upvoted 👌 (Mana: 0/6) Get profit votes with @tipU :)