Heikin-Ashi Advanced Trading Strategy
Hello everyone, How are you doing, I welcome you again to my blog in the Steem Alliance community.
Today, we will discuss an interesting topic on the platform which will be: Heikin-Ashi Advanced Trading Strategy
- Introduction
Heikin-Ashi is a candlestick charting strategy that removes market noise, making it easier to differentiate between trends and potential market reversals.
The heikin-Ashi chart is a chart that helps smooth price data and also provides a more accurate picture of market direction than the typical candlestick charts.
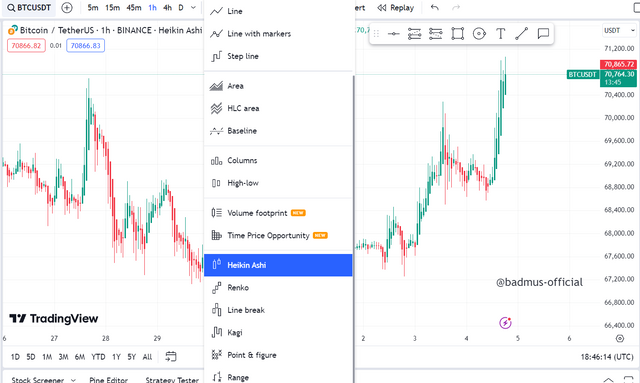
The identity of heikin-ashi is almost similar to the normal candlestick, just that in it case, it usually filters out the noise seen on the normal candlestick.
- Open: (Previous Heikin-Ashi candle's open + close)
- Close: (Open + High + Low + Close)
- High: The highest point of the current period, Heikin-Ashi open, or Heikin-Ashi close.
- Low: The lowest point in the current period, as indicated by the Heikin-Ashi open or close.
The Heikin-Ashi Candles: - Heikin-Ashi candles use the same color system as ordinary candles (usually green for bullish and red for bearish).
Heikin-Ashi charts help to identify trends and potential reversals by smoothing out price volatility.
1 . Identify Trends:
- Uptrend: - Constant green candles with small lower candles usually indicate a strong uptrend.
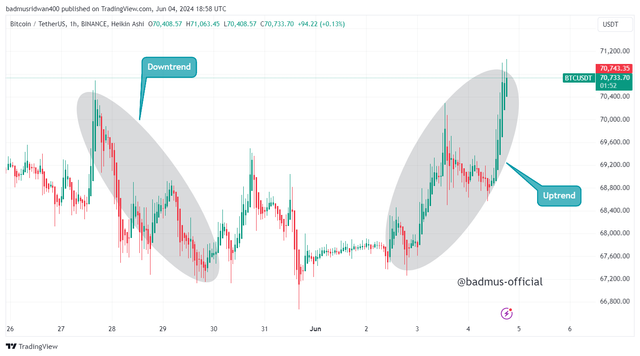
- Downtrend: - Constant red candles with small upper candles usually indicate a strong downtrend.
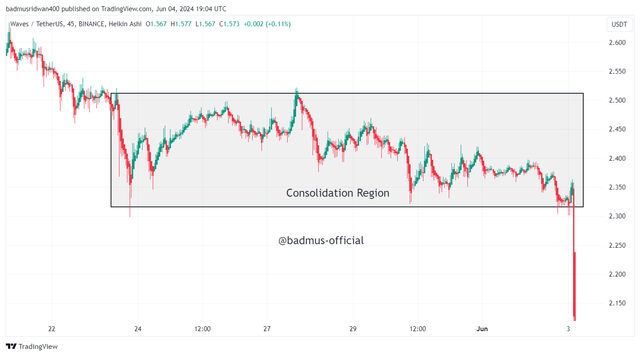
2 . Spotting Reversals: - Small candles with upper and lower handles may likely indicate a market reversal or consolidation.
1: Trend Following Strategy
Heikin-Ashi charts are very useful for trend-following strategies since they can easily identify real market trends.
- Entry and Exit Points: -
Long Position: Enter when a series of green Heikin-Ashi candles appear, signaling the beginning of an uptrend.
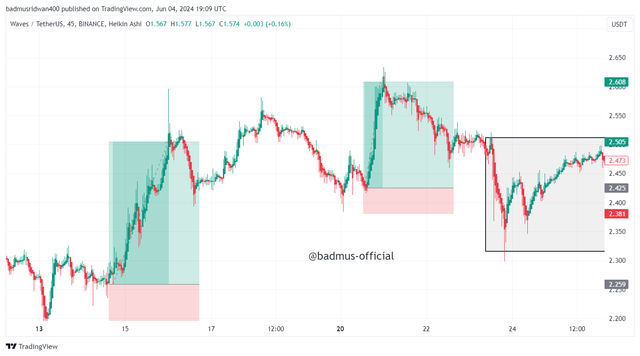
- Exit when a red candle appears, indicating a possible trend reversal.
Short Position: Enter when a series of red Heikin-Ashi candles appear, signaling the beginning of a downtrend.
- Exit once a green candle forms.
2: Support and Resistance Strategy
Heikin-Ashi charts can help you identify support and resistance levels, which is important for making better trading decisions in most cases.
Identify Key Levels:
Support levels are those levels where prices constantly fall to and reverse back higher.
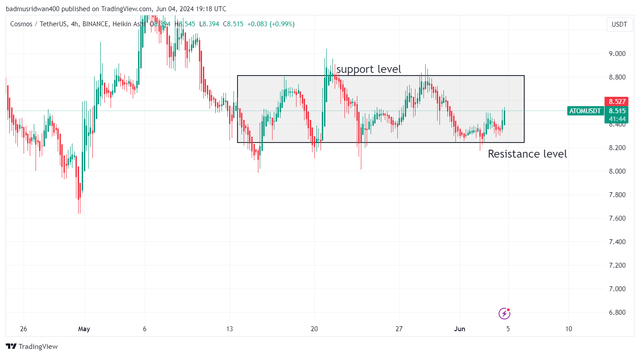
- Resistance levels are those levels where the price continually hits a top, and then reverses lower as we can see in the image description above.
Trading Around Levels: Place buy and sell orders near the identified support and resistance levels.
The heikin-Ashi chart is a useful tool for traders, providing greater clarity into trends, and reversals, and removing the market noise.
Traders can increase their trading winning rate by using this strategy which involves trend following, reversal identification, and support and resistance trading.
' NB: This post concerns education, not investment advice. Digital asset prices are subject to change. All forms of crypto investment have a high risk. I am not a financial advisor, before jumping to any conclusions in this matter please do your research and consult a financial advisor
https://x.com/_bhardmorse/status/1798078530032750972
Upvoted! Thank you for supporting witness @jswit.
@tipu curate
;) Holisss...
--
This is a manual curation from the @tipU Curation Project.
Upvoted 👌 (Mana: 5/8) Get profit votes with @tipU :)
Note:- ✅
Regards,
@jueco