Trading using Fibonacci Retracement Levels
 |
|---|
INTRODUCTION |
Are you wondering how traders and investors identify potential levels of support and resistance of an asset in cryptocurrency or financial markets? Well, one powerful tool they use is the Fibonacci retracements, which we are to learn for this week's engagement challenge, so I hope you get to learn something valuable today.
Explain the concept of Fibonacci retracement as a technical analysis tool and how it is applied in crypto markets. |
|---|
Fibonacci retracement is a tool used in technical analysis to identify potential levels of support and resistance in financial markets, including the crypto market. It's based on the Fibonacci sequence, a series of numbers where each number is the sum of the two preceding numbers (e.g., 0, 1, 1, 2, 3, 5, 8, and so on).
In crypto markets, traders use Fibonacci retracement to identify potential price levels where a cryptocurrency might experience a pullback or a bounce. These levels are based on certain percentages derived from the Fibonacci sequence, such as 38.2%, 50%, and 61.8%.
Here's how it works:
When a cryptocurrency is experiencing an uptrend, traders draw Fibonacci retracement levels from the lowest point to the highest point of the trend. These levels act as potential support levels, indicating where the price might find buying interest and reverse the pullback.
On the other hand, during a downtrend, traders draw Fibonacci retracement levels from the highest point to the lowest point, which act as potential resistance levels.
By using Fibonacci retracement, traders can anticipate price movements and make more informed decisions about when to buy or sell cryptocurrencies.
However, it's important to note that Fibonacci retracement is just one tool among many used in technical analysis, and it's not foolproof. Market trends can be influenced by various factors, so it's always wise to consider other indicators and do thorough research before making any trading decisions.
Let's say we're looking at a cryptocurrency that has been on a strong uptrend, and we want to use Fibonacci retracement to identify potential support levels.
First, we would draw the Fibonacci retracement levels from the lowest point to the highest point of the uptrend. These levels are typically set at 38.2%, 50%, and 61.8% of the price range.
For example, if the cryptocurrency's price went from $100 to $200 during the uptrend, we would draw the retracement levels at $138.20, $150, and $161.80.
These levels act as potential support levels. So, if the price of the cryptocurrency starts to pull back from its high point, traders often look for buying opportunities near these Fibonacci retracement levels.
If the price bounces off one of these levels, it could indicate that the uptrend is still intact and the price may continue to rise.
Utilize Tradingview to illustrate Fibonacci retracement levels on the BTC/USDT, ETH/USDT, and STEEM/USDT pairs. (Include screenshots to showcase retracement levels during both uptrends and downtrends). |
|---|
Drawing Fibonacci retracement levels on a price chart is quite simple to do and here is a step-by-step guide.
Step 1: Identify the trend: First of all, is for you to check if the trend is an uptrend (price moving upwards) or a downtrend (price moving downwards).
Step 2: Select the starting and ending points: For an uptrend, choose the lowest point (swing low) and the highest point (swing high) of the trend. For a downtrend, it's the opposite, i.e you choose the highest point (swing high) and the lowest point (swing low) of the trend.
Step 3: Draw the retracement levels: Locate the Fibonacci retracement tool. Click and drag from the swing low to the swing high for an upward trend, and the opposite for a downward trend to draw the retracement levels on the chart.
Step 4: Identify the retracement levels: The most commonly used retracement levels are 38.2%, 50%, and 61.8%. These levels indicate potential support or resistance areas where the price may reverse or consolidate.
Step 5: Analyze price action: Observe how the price interacts with the retracement levels. If the price bounces off a retracement level, it could indicate a potential support or resistance area.
To get all the steps and pictorial guide of the steps click Here. Now let us look into the various charts as required.
The charts below shows the application of the Fibanocci Retracements on the up and down trends of all the pairs given with all pairs in the 1 day timeframe.
Uptrend Application
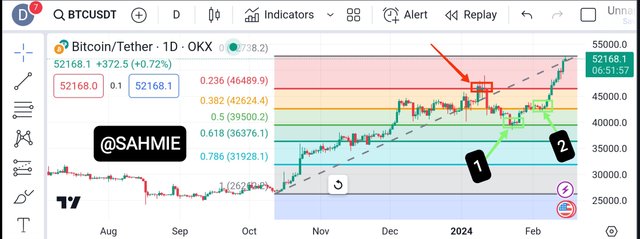
From the above screenshot, we can see the Fibanocci Retracements applied to the upward trend of a BTC/USDT chart, with the Green arrows pointing the Support levels and the Red arrow pointing at the resistance.
Downtrend Application
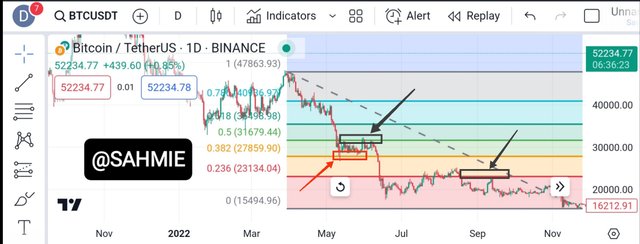
From the above screenshot, we can see the Fibanocci Retracements applied to the downward trend of a BTC/USDT chart, with the gray arrows pointing the Support levels and the Red arrow pointing at the resistance.
Uptrend Application
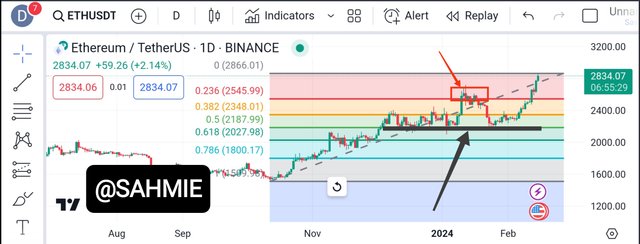
The above screenshot shows the Fibanocci Retracements applied to the upward trend of a ETH/USDT chart, with the Gray arrow pointing the Support levels and the Red arrow pointing at the resistance.
Downtrend Application
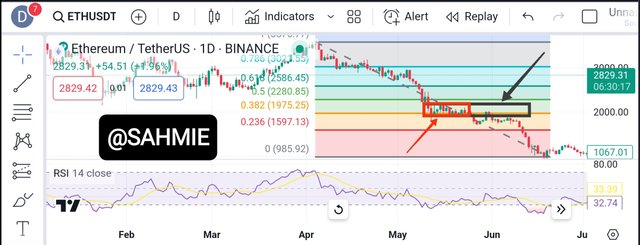
The above screenshot shows the Fibanocci Retracements applied to the downward trend of a ETH/USDT pair chart, with the Gray arrow pointing the Support level and the Red arrow pointing at the resistance.
Wondering why both the support and resistance is on the same point? Well that is due to the fact that every resistance surpassed becomes the new support and vice visa.
Uptrend Application
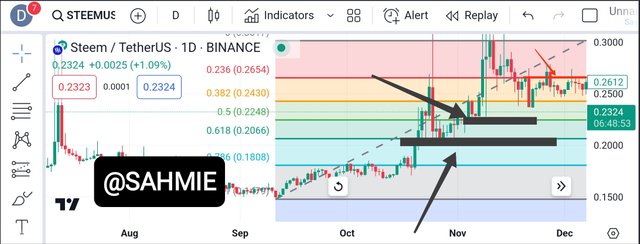
The screenshot above shows the application of the Fibanocci Retracements the upward trend of a STEEM/USDT pair chart, with the Gray arrows pointing at the Support levels and the Red arrow pointing at the resistance.
Downtrend Application
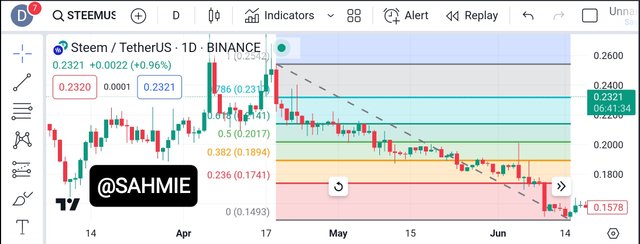
From the above screenshot, we can see the Fibanocci Retracements applied to the downward trend of a STEEM/USDT pair chart.
You might be wondering why the support of the downward trend is the one above, with the resistance below, right? Yes it is so because it is the opposite of the uptrend, in this case profit is made as the trend continues downward, hence the resistance is below the support.
Break down the significance of key Fibonacci levels (e.g., 0.382, 0.500, 0.618) and explain how traders interpret these levels for potential support and resistance areas |
|---|
Alright, let us look into the significance of the key Fibonacci levels in trading. Fibonacci levels, such as 0.382, 0.500, and 0.618, like I said earlier are all derived from the Fibonacci sequence, which is a series of numbers where each number is the sum of the two preceding ones (like 0, 1, 1, 2, 3, 5, 8, and so on).
Traders however use these Fibonacci levels to identify potential support and resistance areas in the market. Support levels are where the price tends to stop falling and may start to rise, like the trough of a mountain where climbing starts, while resistance levels are where the price tends to stop rising and may start to fall, like the peak of the mountain where descending occurs.
These levels thus act as psychological zones where traders often make the decisions to either buy or sell, that is to either enter or exit the market. Let us know and look into details of the various levels then, shall we?
The 0.382 level is often referred to as the "38.2% retracement level" and it is a level traders look for potential support or resistance during price pullbacks.
The 0.500 level, also known as the "50% retracement level," and this level is considered a significant retracement level which indicates a potential reversal in the price trend.
The 0.618 level, known as the "61.8% retracement level," is considered a strong retracement level, hence this level is closely watched by traders for potential support or resistance.
Now let us look into how traders interpret these levels for potential support and resistance areas.
When traders interpret Fibonacci levels for potential support and resistance areas, they do so by looking for price reactions around these levels to determine the significance of their trade.
Let us start with how traders find potential support areas. A trader uses the Fibonacci levels to find support when the price of an asset is on a downtrend and starts to pull back or retrace, to do so, traders will look for potential support (trough) at Fibonacci levels like 0.382, 0.500, and 0.618.
If the price finds support at these levels and starts to bounce back up, it could indicate that buyers are stepping in and the downtrend might be losing momentum. Hence, a trader may consider this as a potential buying opportunity or market entry point, expecting the price to reverse and continue higher.
On the other hand, resistance areas come into play when the price of an asset is in an uptrend and starts to retrace or pull back. Therefore, traders will look for potential resistance (i.e., the peak point) at Fibonacci levels like 0.382, 0.500, and 0.618.
If the price reaches these levels and encounters selling pressure, causing it to reverse and start declining again, this could mean that sellers are active and the uptrend might be losing strength. Hence, indicates to traders that it may be a potential selling opportunity (market exit point), as they expect the price to reverse at that point and continue lower.
Explore the synergy of Fibonacci retracement with other technical indicators (e.g., Moving Averages, RSI). Discuss how a combination of tools can provide a more robust analysis. |
|---|
Even as I tagged the Fibonacci levels as a treasure map for locating trading opportunities, it is important to note that Fibonacci levels are not magical lines that always guarantee support or resistance.
Therefore, traders should use them as a guide, along with other technical analysis tools, to assess the probability of price reversals and make better-informed trading decisions.
This is where the likes of the Moving Average (MA), Relative Strength Index (RSI), Trend Lines, Chart Patterns, and Trade Volume come into play to help traders by combining them with the Fibonacci Levels to confirm potential support or resistance areas.
Therefore, the synergy between Fibonacci retracement and other technical indicators like Moving Averages and RSI can provide traders with additional confirmation and insights into potential price movements, helping traders make more informed and precise decisions in the market. Take the Moving Average and The Relative Strength Index (RSI) for example.
Moving Averages:
These indicators help smooth out price data and identify trends. Therefore, when used together with Fibonacci retracements, traders can look for connections between the retracement levels and key moving average levels.
For example, if the price retraces to a Fibonacci level and aligns with a moving average support, it could strengthen the potential support area. Whereas, if the price retraces to a Fibonacci level and aligns with a moving average resistance, it could also enhance the resistance area.
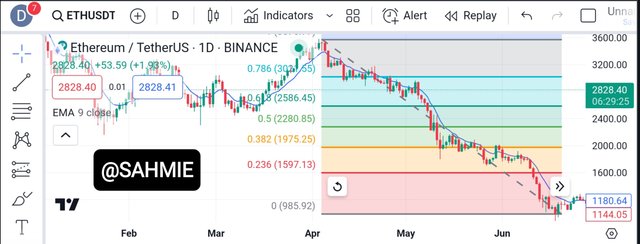
The screenshot above shows the application of the Exponential Moving Average along with the Fibanocci Retracements tool on a ETH/USDT pair chart under the 1 day timeframe, and we can see that the prices align on both tools align perfectly.
Relative Strength Index (RSI):
RSI is a rate oscillator that is used to measure the speed and change of price movements. Therefore, when combined with Fibonacci retracement, traders can look for RSI deviations or confirmations at key retracement levels.
For instance, if the price retraces to a Fibonacci level and the RSI shows bullish divergence (higher lows), it could suggest a potential reversal and support the idea of a bounce. On the other hand, if the price retraces to a Fibonacci level and the RSI shows bearish divergence (lower highs), it could indicate a potential reversal and support the idea of a downward move.
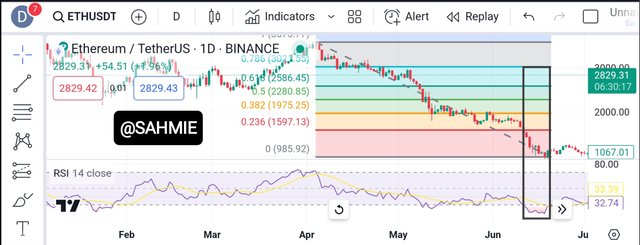
The screenshot above shows the application of the Relative Strength Index (RSI) along with the Fibanocci Retracements tool on a ETH/USDT pair chart under the 1 day timeframe. Here, you can perfectly see how the points where the price entered the danger/red zone on the Fibanocci Retracements tool and the RSI indicators aligning with it (the gray rectangle). Signifying a likely adjustment in price movent, which did occur, but not for long.
Therefore, by using the Fibonacci retracement alongside Moving Averages and RSI, traders can gather more information about potential support and resistance levels, as well as the strength of price movements.
 |
|---|
When we combine different tools in our analysis, it's like having a team of experts working together to provide a more comprehensive view of the situation.
With each tool having its own strengths and weaknesses, just like different the experts have their various areas of expertise, hence by bringing them together, we get to benefit from their unique perspectives and insights.
Therefore, when we are analyzing a price chart for a stock or cryptocurrency, we can use tools like technical indicators (such as moving averages or RSI) to understand price trends and momentum, as these indicators give us clues about whether the stock or cryptocurrency is likely to go up or down.
But that's not all as we can also look at the direction of fundamental analysis, which involves examining the assets finances, competitive position, developments, acceptance level and trends because this helps us understand the underlying value of the asset.
Because by combining both technical analysis and fundamental analysis, we get a more robust picture of the asset. We can see if the technical indicators align with the fundamental factors. If they do, it strengthens our analysis and gives us more confidence in our decisions. This also applies to using a combination of indicators in analyzing a specific market.
Then again, in addition to these tools, we can also consider market sentiment, news events, and other factors that may impact the asset's performance. Because by considering multiple perspectives, we can help reduce the risk of relying solely on one tool or missing important information.
So, when it comes to analysis, using a combination of tools is like having a well-rounded team of experts, with each tool bringing its insights, and together they provide a more robust analysis, just like getting multiple opinions to make a more informed decision.
Specifically analyze the recent price action of STEEM/USDT using Fibonacci retracement. |
|---|
For this, let us go back to our STEEM/USDT pair chart, under the 1 day time frame as shown below.
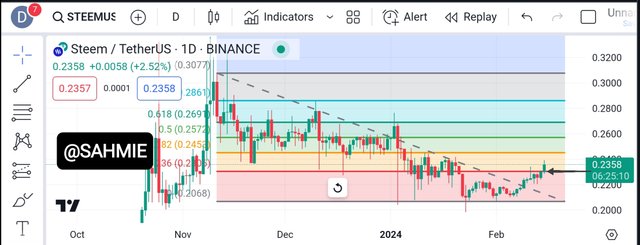
From the above screenshot, we can see that the STEEM/USDT pair has been experiencing a downward trend since November under the 1 day timeframe, however it has begin to experience a bounce back as it has break through its first resistance level (the gray arrow mark). Now, hopefully this becomes it's support level at which growth is expected and it doesn't break below again. To support this my theory and expectations, I've used the Fibanocci Retracements in combination with the Exponential Moving Average and RSI as shown below.
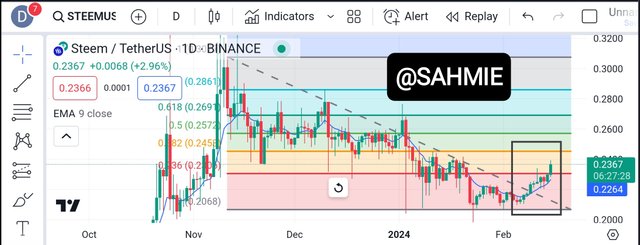
The above screenshot shows the combination of the EMA and Fibanocci Retracement, all showing the downward trend and a bounce back (gray rectangle) as earlier hoped with the Fibanocci Retracements tool.
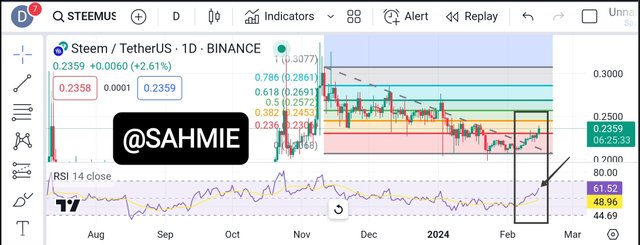
Now, the above screenshot shows the combination of the RSI and Fibanocci Retracement, like the previous tools, it also shows the downward trend and the potential bounce back, but however a big disparity with the moving average, as the moving average as at the time of this screenshot was 48.96 while the RSI rate signals at 61.52 giving a difference of 12.56.
And again, I can't help but notice that the ratio 61.52 is closer to the 70 mark, at which it is expected to have a reverse as we understand of the RSI indicator, suggesting that the 0.382 level is out resistance to beat if we are to expect a higher growth in the price of Steem.
CONCLUSION |
In conclusion, Fibonacci retracements offer a unique perspective on price movements in financial markets. By identifying potential levels of support and resistance, whereby these retracement levels help traders and investors make better informed decisions. Whether you are a seasoned trader or just starting to explore the world of finance or cryptocurrency, understanding Fibonacci retracements can be a valuable tool in your technical analysis toolkit.
I wish to invite @starrchris, @ngoenyi, @chants and @hamzayousafzai.
Thank You for your Time
NOTE: Always have a smile on your face, as you are never fully dressed without one.

@sahmie your detailed breakdown of Fibonacci retracement and its application in crypto markets is incredibly insightful The charts provide a clear visual understanding making it easier for fellow traders to follow along. The combination of tools like Moving Averages and RSI adds a valuable layer to your analysis. Best of luck in the contest
Thanks so much for your kind words. I'm really glad you found my breakdown of Fibonacci retracement and its application in crypto markets insightful. It's awesome to hear that the charts I provided helped you have a clear visual understanding, making it easier for fellow traders to follow along. And yes, using tools like Moving Averages and RSI can definitely add a valuable layer to analysis. I appreciate your support and best of luck to you too.
Upvoted. Thank You for sending some of your rewards to @null. It will make Steem stronger.
Boss
My senior man.
TEAM 4
Congratulations! This post has been voted through steemcurator07. We support quality posts and comments!Thank you so so much @malikusman1, I really appreciate your support. God bless you.
This highlights the importance of technical analysis tools such as Fibonacci retracement levels, in handling the dynamics of the crypto market. Thanks for sharing your knowledge!
I'm glad you found the information about Fibonacci retracement levels helpful. Technical analysis tools like these are indeed important when navigating the ever-changing dynamics of the crypto market. It's great to be able to share knowledge and insights with each other. Thank you for your kind words.
Upvoted! Thank you for supporting witness @jswit.
hey dear @sahmie Great job explaining the concept of Fibonacci retracement and demonstrating its application on the BTC/USDT chart! Your detailed explanation and clear visuals make it easy for readers to understand how traders use this tool to identify potential support and resistance levels in both uptrends and downtrends. Keep up the excellent work...
Thank you so much for the kind words. I'm really glad that my explanation and visuals helped you understand the concept of Fibonacci retracement and its application on the BTC/USDT chart. It's all about identifying those support and resistance levels, whether the market is going up or down. I hope to keep up the good work too. Thanks again for the encouragement.
Hello friend greetings to you, hope you are doing well and good there.
In crypto markets, traders use Fibonacci retracement to identify potential price levels where a cryptocurrency might experience a pullback or a bounce. Yes thats very true. I believe SMC and Fibonacci are the best way to find the retracement in the market. It can give us the best and accurate price movement.
You have mentioned the best levels of Fibonacci.These levels are based on certain percentages derived from the Fibonacci sequence, such as 38.2%, 50%, and 61.8%. Yes very true we called them the golden levels of Fibonacci. The using of Fibonacci is very easy now after reading your post. You have explained each and every step very clear and vavid.
I wish you very best of luck in this contest.
Thank you so much for your kind words. I'm really glad that my post helped you understand how to use Fibonacci retracement in the crypto markets. It's true, these Fibonacci levels, like 38.2%, 50%, and 61.8%, are often referred to as the golden levels. They can be really helpful in identifying potential price movements.
I'm happy that you found my explanation clear and vivid. Making it easy for readers to understand is always my goal. Thank you for your support and best wishes in the contest and good luck to you too.
Dear @sahmie,
It is great reading through your article once more.
You have clearly explained what Fibonacci retracememt is and how the percentage ratios are derived.
You have also clearly shown using charts of 3 crypto pairs to illustrate it's usage during an uptrend and a downtrend.
Those 3 key levels are specific levels to watch since crossing those ratios can actually mean in total reversal of trend especially in higher time frames.
Thank you for the insightful writeup.
Wishing you the best in this contest.
Greetings Ma,
Thanks for reading my article and finding it helpful. I'm glad I could explain Fibonacci retracement and how the percentage ratios are calculated in a clear way. It's great that the charts of the crypto pairs helped illustrate its usage during uptrends and downtrends. Those key levels are definitely important to watch, as crossing those ratios can signal a complete reversal of the trend, especially in higher time frames. I appreciate your kind words and good wishes for the contest. Best of luck to you too.