Steemit Crypto Academy Contest / S14W4 - Fibonacci Retracements
 |
|---|
INTRODUCTION |
We've all seen or heard of hidden treasures and maps to find them. Haven't we? Fibonacci Retracements are the treasure maps that help traders through the volatile market in the world of trading in search of hidden treasures.
 |
|---|
Hence, knowing how the Fibonacci Retracements work and how to use them correctly, will increase a trader's chance of finding hidden treasures in the financial market through making informed decisions.
In your own words, what are Fibonacci Retracements and what are they used for? |
|---|
Fibonacci Retracements are technical analysis tools used by traders in financial and stock markets to help identify potential levels of support and resistance.
They serve as a way to predict where the price of a stock, currency, or other financial asset might bounce back or reverse after a significant move. Hence, Fibonacci Retracements help traders identify levels where a stock or currency might find support or resistance.
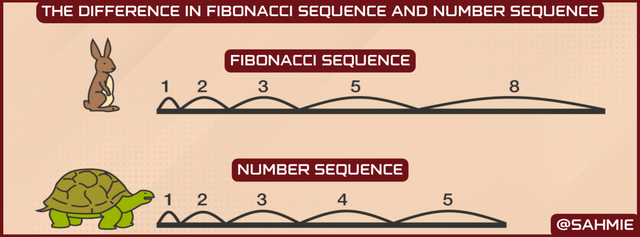
Fibonacci Retracements are special ratios originating from the Fibonacci Sequence, a series of numbers that starts with 0 and 1, where each number after the first two "0" and "1" are obtained by adding the two numbers before it.
 |
|---|
Therefore, the Fibonacci Sequence reads 0, 1, 1, 2, 3, 5, 8, and so on, from 0, 1, (0+1) = 1, (1+1) = 2, (1+2) = 3, (2+3) = 5, (3+5) = 8, etc. Which gives us the ratios of 23.6%, 38.2%, 50%, 61.8%, and 100%.
Where the;
23.6% indicates a minimal retracement level and is typically viewed as the least significant of all retracement levels.
38.2% is this level that comes into play in markets where deeper retracements are experienced. This level is usually considered a strong indication of a reversal to take place.
50% is considered a significant support or resistance level, although it doesn't always hold.
61.8% level is often referenced in markets that have retraced a significant portion of a move, and it's where traders watch for a potential reversal to occur.
100% is not a Fibonacci retracement level but is included because it represents the original price levels. This level is where a market will move back to its initial starting point.
These Fibonacci Retracement levels are used by traders to determine levels where price movement may pause or reverse.
When a market experiences an uptrend or downtrend, it will often retrace a portion of the move before continuing in the same direction, this is where traders use the Fibonacci retracement levels to identify potential levels of support or resistance, in other words, where the price may pause or reverse.
The Fibonacci Retracements are most useful when the market is moving in a clear direction, that is when the market is either going up (Bullish) or down (Bearish).
When the market is going up, the idea is to buy (go long) when there's a retracement at a support level, and when the market is going down, the plan is to sell (go short) when there's a retracement back at a resistance level.
Therefore, the Fibonacci Retracements are analysis tools we use to make better trading decisions based on market trends.
Explain the most important Fibonacci levels and show at least one example on a chart of a cryptocurrency pair |
|---|
The most important Fibonacci levels are 38.2%, 50%, and 61.8%. These levels are considered important because they symbolize potential support and resistance levels where the price of an asset may pause, retrace or reverse.
Below is an example of how Fibonacci Retracement levels are used in technical analysis on the chart of a cryptocurrency pair.
The screenshot below is a 30-minute chart of Ethereum (ETH) against the US Dollar (USD) on TradeView, of which I will be using the Fibonacci retracement tool to identify potential support and resistance levels.
 |
|---|
The image above shows the retracement levels drawn by the Fibonacci tool. The Green box marks the area where the price retraced after hitting the high point and starts to move down, whereas the Red box marks the point at which the price is expected to most likely retrace back to the Green zone, marking it a likely Resistance zone.
The price retraced from the high point to the 38.2% (no. 1, purple arrow) Fibonacci level at around 2259.96. The 38.2% level acted as a support, and the price bounced back up from the 23.6% (no. 2, Red arrow) Fibonacci level at 2285.21, the 23.6% level acted as a resistance.
This is because, the price retraced further to the 61.8% Fibonacci level at around 2291.13, which acted as a support level as when the price touched the 61.8% level it bounced back up, indicating strong buying pressure.
The buying pressure pushed up the price so that it broke through the resistance level of 2239.54 at the 50% Fibonacci level, but couldn't break through the resistance level of the 38.2% Fibonacci level at around 2259.96 (no. 4, the 3 yellow arrows) even after three attempts, hence the 38.2% Fibonacci level acted as strong resistance indicating a strong selling pressure leading to a reversal in the trend that even broke the 61.8% Fibonacci level at around 2291.13 support level.
In this example, the 23.6%, 38.2%, and 61.8% levels were significant levels that acted as support or resistance levels. By observing how the price reacts to these levels, traders can gain insight into potential trend reversals and make informed trading decisions.
Use the STEEM/USDT chart and show how Fibonacci retracements work |
|---|
To do this, I will be using the Tradeview chart of the STEEM/USDT chart. But first, I would like to show everyone how to add the Fibonacci Retracements to the Chart before explaining how it works. Therefore, below is how to add the Fibonacci Retracements to a chart using Tradeview.
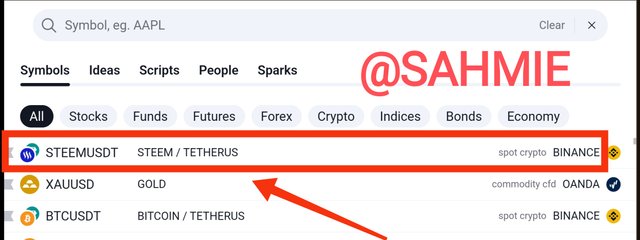
Step 1: Just open the Tradingview platform on your device, at the top of the screen, you'll see a search bar. Just type in "STEEM/USDT" there, and you'll find the trading pair.
 |
|---|
 |
|---|
Step 2: Once you have the chart on display, locate and click on the Fibonacci button (the four horizontal lines with "0" ending on the 2nd and 4th lines in the opposite directions), usually located on the left-hand side of the chart.
 |
|---|
Step 3: Click on the "Fibonacci Retracement" at the top of the menu.
 |
|---|
Step 4: Adjust the locator to your Swing High or Swing Low for Uptrend or Downtrend respectively.
 |
|---|
Note:
A "Swing High" is a candlestick that has two lower highs on its left and right sides. It's like a peak surrounded by smaller peaks.
 |
|---|
While, a "Swing Low" is a candlestick that has two higher lows on its left and right sides. It's like a valley surrounded by smaller valleys.
 |
|---|
Step 5: Drag the cursor to the most recent Swing Low or Swing High for Uptrend or Downtrend respectively.
 |
|---|
And there, you have the Fibonacci Retracements levels calculated for you automatically.
Now, let’s take a look at the STEEM/USDT chart and show how Fibonacci retracements work, I will be using the 1-Day chart.
 |
|---|
From the screenshot above, the price retraced from the high point to around the 50% Fibonacci level at around 0.2248. The 50% level acted as a support, as the price of Steem bounced back up to the 23.6% Fibonacci level at 0.2772, and the 23.6% level acted as a resistance.
This is because, the price retraced back to the 50% Fibonacci level at around 0.2248, with this level acting as a support level means the price bounced back up from this level, indicating strong buying pressure, but ended on the 23.6% level which is also acting as a resistance because the price as being between this two levels as a the time of making this post.
Therefore, it is expected to go both ways because if and when any of these levels are broken, it becomes the new resistance or support. That is, if the 23.8% level is broken it becomes the new support and if the 50% is broken, it becomes the new resistance.
However, from the interpretation, I can say the price of Steem has been stable for the time being as it hasn't broken the 23.6% resistance level nor the 50% support level for a while.
Advantages and disadvantages of Fibonacci retracements |
|---|
They are Easy to Use:
Fibonacci Retracements are simple tools that traders use to find potential levels where prices might go up or down. It's not too complicated to understand or use them.
Finding Support and Resistance:
These Retracement levels help traders identify levels where prices might stop going up or down and start moving in the opposite direction. It's like finding areas where prices might bounce back.
Better Entry and Exit Points:
Traders use Fibonacci Retracements to figure out good times to buy or sell. By looking at these levels, they can make smarter decisions about when to start or end a trade.
Combining with Other Tools:
We can use Fibonacci Retracements along with other indicators to get a clearer picture. It's like putting puzzle pieces together to confirm our trading decisions.
Not Always Clear:
Sometimes it's hard to decide which points to use when drawing Fibonacci retracements. Different traders might choose different points, which can make it a bit subjective.
Not Always Reliable:
While Fibonacci Retracements can be helpful, they're not always accurate. Market prices are influenced by many things, so relying only on these retracements might not always give us the right answer.
Not Exact:
Fibonacci Retracements may give us a range of possible levels, but they don't give us precise price levels therefore, traders may need to use other tools to get more precise information.
Too Popular:
Because Fibonacci Retracements are popular, many traders use them. This can sometimes lead to situations where lots of traders react to the same levels, which can affect market behaviour.
CONCLUSION |
In conclusion, the Fibonacci Retracements we've explored can act only as a guide leading traders to potential turning points in the market, helping traders to identify optimal entry and exit points, eventually boosting traders' chances of profitability. However, beware that these Fibonacci Retracements are not fail-proof, so they need to be supported by other tools to make the most of them.
I wish to invite @starrchris, @ngoenyi, @chants and @hamzayousafzai.
Thank You for your Time
NOTE: Always have a smile on your face, as you are never fully dressed without one.

Saludos gran amigo sahmie, como ya nos tienes acostumbrados, nuevamente nos entregas una muy buena participación, con ejemplos claros, con buenas imágenes diseñadas por ti y con una estructura muy ordenada. Buena calificación, de seguro estarás entre los tres mejores. Suerte.
Greetings friend. Thank you for your kind words and encouragement. I'm happy that you found my participation valuable and enjoyed the examples and structure. Your support means a lot to me. I will be keeping my fingers crossed for a spot among the top three. Wish me luck.
Upvoted. Thank You for sending some of your rewards to @null. It will make Steem stronger.
Absolutely spot on! Fibonacci retracement levels serve as valuable guides for identifying potential pause or reversal points in price movements.
Whether it's an uptrend or downtrend, having a strategic plan to buy at support levels during retracements in an upward market and sell at retracement resistance levels during a downward market is a sound approach. It's all about navigating those market trends wisely!
I have also participated in the contest, do well to check it out and engage. My post link to the contest.
You're right, Friend. The Fibonacci retracement levels are like helpful signposts that can show us where the price might take a breather or even change direction. Whether the market is going up or down, it's smart to have a plan in place. Buying at support levels during upward retracements and selling at resistance levels during downward retracements can help us navigate those market trends wisely. Thank you for your valuable comment.
What a nice explanation you have done concerning the topic; Fibonacci retracements. It is a best tool to forcast the market which your explanation has vital information on the giving topic. Success to you sir.
Thanks for your kind words about my explanation of Fibonacci retracements. The Fibonacci retracements are tools that traders use to predict potential levels where a stock or market might "bounce back" or reverse its direction. It's like finding those sweet spots where the price could change. It's great to hear that you found the information valuable. I wish you continued success.
As usual boss @sahmie you always amaze me with your well detailed, navigated and quality post on this platform. Besides that, I appreciate your efforts for the way you gave a detailed, easy to understand explanation of the tool called Fibonacci retracements. Your introduction already made love your post already. It really captured my heart as well as other readers
The Fibonacci retracements are Great tools used by traders in the market space to determine and make entry and exit points in the market. It's just one of the instruments used by stock market participants to predict potential future stock price movements.... I also came to understand that this tool gives us more better analysis and accurate results when we use it with other indicators...
Giving a Step by Step process of how the FB retracements works using the STEEM/USDT chart was another thing that made your Post outstanding Sir..
Advantages comes with disadvantages. You did a good thing by mentioning the advantages and disadvantages with brief explanation.
Thanks for sharing and good luck with the challenge.....
Thanks for your awesome feedback, it brings joy to my heart. I'm glad you found my explanation of Fibonacci retracements helpful. It's a tool that traders use to predict stock price movements and determine entry and exit points. Combining it with other indicators can give you even better analysis.
I'm thrilled that you liked the step-by-step process using the STEEM/USDT chart. Practical examples always make things easier to understand. And it's important to mention the pros and cons of using Fibonacci retracements for a balanced view.
Thanks for your support and good luck.
You have given a detailed explanation of the topic in question. It comes in handy for traders in determining where to enter a trade in the event of the upward and downward movement. One can be able to determine where the next move will stop or start. But it's all subjective and a lot of techniques has to be employed as trading is just what it is- trading, always subjective and not objective.
Your charts provide more details on the topic and they prove that you really have studied this a lot and have come to understand it the more.
Great efforts! You will soon be a professor of crypto. Keep it up
Greetings ma,
Thank you for your kind words, while the Fibonacci retracement strategy helps traders figure out good points to enter trades when the price goes up or down, it's not a sure thing though, because trading is subjective and different techniques are used.
I'm glad you found my explanation helpful, and I appreciate your encouragement. About being a professor in the academy is a big praise that I seems to be very far from as all I do is do my research like every other person and present my findings, but it would be fun though.
Your explaination of Fibonacci retracements is truly impressive, offering invaluable insights into market forecasting.
Your explanation holds vital information for traders. Wishing you success in your endeavors!
Thank you, I'm really glad you liked my explanation of Fibonacci retracements. It's awesome to hear that you found it helpful for predicting market trends. Your support and well wishes mean a lot to me. I'll keep working hard to bring you more valuable insights. Thanks again
pleasure 👍😍🙏🙏🙏
Hola amigo, como siempre nos trae todas las semana tu investigación y análisis de cada tema que seguro facilita el conocimiento y comprensión de los lectores.
Es muy didáctico la forma de explicar la diferencia de la secuencia de Fibonacci y la secuencia numérica con la liebre y la tortuga que facilita la comprensión del lector.
Explicas con detalle y claridad cada nivel de retroceso y su utilidad en la identificación de las zonas de soporte y resistencia, así como las ventajas y desventajas.
Excelente contenido amigo. ¡Suerte y éxitos!
Thank you so much for your kind words. I'm happy to hear that you find my research and analysis helpful in expanding your knowledge and understanding.
I'm also glad you found the explanation of the Fibonacci sequence and the numerical sequence with the hare and the tortoise easy to grasp. For me, it's all about making things relatable and understandable.
In all, I'm really glad you appreciated the detailed explanation of each retracement level and its role in identifying support and resistance zones, along with the pros and cons. Your support means a lot to me, and I'm grateful for it. Wishing you all the luck and success too, my friend.
Hey dear friend
Just as expected my dear friend you have written so so well in fact as I have see it before you wrote like someone who have a professional degree in crypto trading and in Fibonacci retracement strategy. Please continue sharing such quality and powerful post on steemit to boost it ecosystem.
Thank you so much for your kind words, my dear friend. I'm thrilled that you find my posts on crypto trading and Fibonacci retracement strategy valuable. Your support means a lot to me.
I'm just not a professor yet, but a learner like you. I'm always grateful for the professors for bringing up interesting topics for us to learn from. Once again thank you.