SEC S18-W2 || Mastery of Moving Averages and Fibonacci Retracements
 |
|---|
Greetings friends and welcome to my participation for the weeks engagement challenge from this amiable community where we to learn about mastering Moving Averages and Fibonacci Retracements. Hope you get to learn something new today as I attend to the hints as provided.
What is the difference between a simple moving average (SMA) and an exponential moving average (EMA)? Explain how each is calculated and their typical use in trading. |
|---|
Before we differentiate these two concepts, it's only proper we know what both Simple Moving Average (SMA) and Exponential Moving Average (EMA) are all about, so let's go.
Simple Moving Average (SMA)
A Simple Moving Average (SMA) is like a smoothie of an asset or stock prices as it takes the average price of the asset or stock over a specific period, like 5, 7 or 10 days, and keeps updating that average every day. Therefore it smooths out the daily ups and downs in the price of the asset or stock, giving us a clearer picture of the asset or stock's overall trend.
However, the longer the period, the smoother the average becomes and the better as it helps traders see trends and make decisions based on the asset or stock's general direction.
Therefore, traders use Simple Moving Averages (SMA) to spot trends in the financial market of an asset or stock prices, where if the asset or stock's price is above the moving average, it could indicate an uptrend, suggesting the asset or stock might continue to rise, whereas if the price falls below the moving average, it might signal a downtrend, suggesting the asset or stock could keep dropping. Hence using the crossover of these different moving averages to make buy or sell decisions. Making it a helpful tool to understand the asset or stock's direction and make informed choices in the market.
Remember we said SMA are smoothies of an asset's price over some time taking its average, hence calculating a Simple Moving Average (SMA) is like making a daily smoothie.
Let's say we want to find the 5-day Simple Moving Average (SMA) of an asset's prices. Since it's the average, therefore we will need to add up the asset's prices for the last 5 days and then divide that total by 5 to get the average price.
i.e
SMA = (Day 1 price + Day 2 price + Day 3 price + Day 4 price + Day 5 price) ÷ 5 (total number of days)
For example, if the asset's prices for the last 5 days are:
Day 1: $20
Day 2: $22
Day 3: $25
Day 4: $24
Day 5: $23
To calculate the 5-day Simple Moving Average (SMA) after Day 5, we add up these prices;
=> $20 + $22 + $25 + $24 + $23 = $114.
Then divide by 5 (the number of days):
SMA = $114 / 5 = $22.80.
So, the 5-day Simple Moving Average after Day 5 is $22.80.
Doing so helps smooth out the daily price fluctuations and gives you a better sense of the asset's overall trend.
Exponential Moving Average (EMA)
Exponential Moving Average (EMA) works just as the Simple Moving Average but as a high-tech smoothie compared to the Simple Moving Average, because the EMA gives more weight and preference to recent prices, making it more responsive to price changes. That is, it is more like having a smoothie that tastes more like the last fruit you added. Therefore this helps traders catch trends quicker than with the Simple Moving Average.
Therefore traders use the Exponential Moving Average (EMA) like a turbocharged tool to spot trends in asset prices. That is, since EMA gives more weight to recent prices, it reacts faster to price changes compared to the Simple Moving Average. Hence, traders read the EMA as when the asset's price crosses above the EMA, it could signal an uptrend, suggesting the stock might keep rising, whereas if the price drops below the EMA, it might indicate a downtrend, suggesting the assets could continue to fall. Therefore, this responsiveness helps traders make timely decisions based on the stock's current momentum.
Calculating the Exponential Moving Average (EMA) is similar to the Simple Moving Average, but with a twist since EMA gives more importance to recent prices, making it react faster to changes.
For example, if we want to find the 5-day EMA of an asset price. Now, to calculate it, we first need to calculate the EMA for the first day using the Simple Moving Average formula. Then, for the following days, we'd use the formula below:
EMA = (Closing Price - EMA(previous day)) x Multiplier + EMA(previous day)
Where the multiplier is calculated based on the number of days we want to calculate, in the case of our 5-day example, the multiplier would be;
Multiplier = 2 / (5 + 1) = 0.3333.
For example, if the closing prices for the last 5 days are:
Day 1: $20
Day 2: $22
Day 3: $25
Day 4: $24
Day 5: $23
Assuming the EMA for Day 1 is $21,
Using the formula above, since we're given the EMA of the previous day as $21, we'll start by calculating the multiplier, which is;
Multiplier = 2 / (5 + 1) = 0.3333.
Now, we can calculate the EMA for the current day using the formula:
EMA = (Closing Price - EMA(previous day)) x Multiplier + EMA(previous day)
Therefore, let's substitute the values:
Day 1: EMA = ($20 - $21) x 0.3333 + $21 = $20.3333
Day 2: EMA = ($22 - $20.3333) x 0.3333 + $20.3333 = $21.2222
Day 3: EMA = ($25 - $21.2222) x 0.3333 + $21.2222 = $22.5926
Day 4: EMA = ($24 - $22.5926) x 0.3333 + $22.5926 = $23.3950
Day 5: EMA = ($23 - $23.3950) x 0.3333 + $23.3950 = $23.1983
So, the EMA values for the 5-day chart would be approximately:
Day 1: $20.33
Day 2: $21.22
Day 3: $22.59
Day 4: $23.40
Day 5: $23.20
This helps traders have a more responsive indicator to track the stock's price movements.
However, traders no longer have to carry out all these calculations today any more as both SMA and EMA are added into indicators in most trading applications. Below I will show you how to adding both SMA and EMA to your trading chart using the Tradeview app looks like.
To any of the Moving Averages on a price chart using TradingView, follow the steps below;
Step 1: On the opened chart, click on the "Indicators" button at the bottom (for App) and at the Top (for web) of the chart.
 |
|---|
Step 2: In the search bar, type "Moving Average" and select it from the list of results.
 |
|---|
Step 3: From the search results, select the moving average of choice to apply to chart.
 |
|---|
Now to the big question, what is the difference between SMA and EMA?
Now from the explanations and examples, let's look at the differences between a Simple Moving Average (SMA) and an Exponential Moving Average (EMA) in a simple way.
Let's imagine we are tracking how fast a car is going. Hence, the SMA is like taking the average speed over a specific distance, giving equal weight to all speeds. It's like looking at the car's speed over the last few miles.
While, EMA on the other hand is like focusing more on how the car is speeding up (acceleration) or slowing down (deceleration) recently, giving more importance to the car's speed changes in the last moments.
Therefore, SMA is like a steady cruise control, while the EMA is like a radar that quickly detects any speed changes. Another difference is that trader uses EMA for its quick reactions to price changes to help them catch trends faster compared to the SMA. Also, traders use the SMA for a broader view of the stock's direction over time and the EMA for a quicker read on current momentum.
 |
|---|
From the above screenshot, we see both SMA (Yellow 💛 line) and EMA (Blue 💙 Line) all under a 9-day range and under the daily chat of BTC/USD. And it can be observed that EMA (67,007) in blue is closer to the assets current price (67,864) in red than the SMA (66,327) in orange.
Therefore, SMA is like having a telescope to see the big picture while EMA is like having a microscope to the tiny details in the market.
Explain what a 'Golden Cross' and a 'Death Cross' are in the context of moving averages. How do these setups influence trading decisions? |
|---|
"Golden Cross" in trading is a special recipe for success and it happens when the short-term moving average, (like the 50-day), crosses above a long-term moving average, (such as the 200-day). It's like when a fast car overtakes a slower one on the highway – signalling a potential uptrend in the asset price.
On the other hand, the "Death Cross" in trading is the opposite of the Golden Cross. In a Death Cross, the short-term moving average (like the 50-day) crosses below the long-term moving average (such as the 200-day). It's like when a slower car on the highway overtakes a faster one, signalling a potential downtrend in asset prices.
There are two ways we can add Golden and Death Crossing on a chart, first is by adding separate Moving Averages as shown above, then altering the duration days and adding the Moving Averages Crossing (MA Crossing) indicator straight from the indicators button as shown below;
Step 1: On the opened chart, click on the "Indicators" button at the bottom (for App) and at the Top (for web) of the chart.
|
|---|
Step 2: In the search bar, type "Moving Average Cross" or "MA Cross" and select it from the list of results.
 |
|---|
Step 3: To set the Moving Average indicator to your desired duration for the short and long periods. Click on the "screw button" or "settings" on your indicator
 |
|---|
Step 4: You can now set your desired duration of days for both the short term and long term moving averages and click Okay below to apply the settings
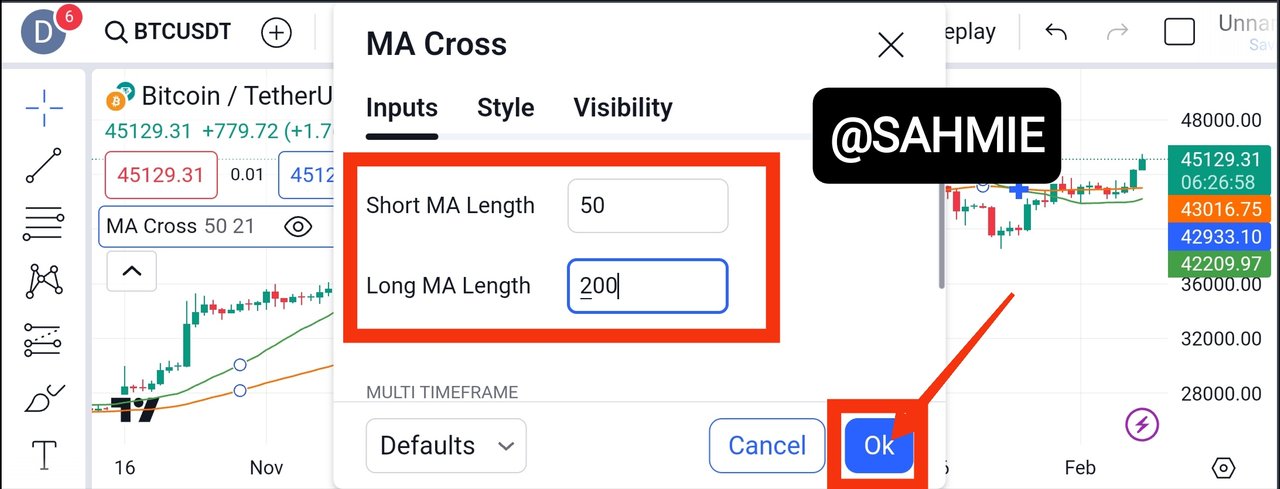 |
|---|
Once you click on the Okay button the changes will be applied as shown below.
 |
|---|
Now remember, the GOLDEN CROSSING is when the shorter moving average crosses above the longer moving average, while the DEATH CROSSING is when the shorter moving average crosses below the longer moving. Hence we can now look at the chart to point out this various crossings.
 |
|---|
From the screenshot shown above, we can see the point(s) of Golden Crossing (GC) in green and Death Crossing (DC) in red on the BTC/USD chart on a 1 Day time frame.
Give a real-life example where Fibonacci retracements can be used to determine support and resistance levels on a trading chart. Use recent market data to illustrate your point. |
|---|
Fibonacci Retracement levels are key levels where traders believe the price of an asset could bounce back or reverse after a big move. However, these levels are calculated based on the Fibonacci sequence, which is a series of numbers where each number is the sum of the two preceding ones.
Traders use these retracement levels to predict potential support or resistance areas in the price. i.e., the floor where the price of a stock or asset tends to bounce off of, meaning it doesn't easily fall below that level (support) or like a ceiling that the price struggles to break above(resistance).
These levels help traders decide when to enter or exit trades based on the expected price movements as traders use these levels to make decisions on when to buy or sell, taking the support levels as where they might consider buying, and the resistance level as where they might think about selling. Therefore, helping traders understand the potential movements of prices in the market.
For the illustration part, let's look at the chart below to apply the Fibonacci Retracement.
 |
|---|
To get the step-by-step and pictorial guide on how to add Fibonacci Retracements to your chart CLICK HERE. Now let us look into the various charts as required.
 |
|---|
From the screenshot above, we can see three (3) support levels in S1, S2 and S3 with S3 being the base of all supports, making it the strongest. We can also see clearly two (2) well defined support levels in R1 and R2, with R2 being the highest ceiling and strongest Resistance. However, have it in mind that any Resistance that is surpassed becomes a New Support and any Support that is broken through becomes a new Resistance.
Design a trading strategy using both EMA and Fibonacci retracements. Describe your approach to entering and exiting a position, as well as risk management. |
|---|
Let's us take our images from the previous section as our reference for this strategy as we've already applied our Moving Average Crossings and Fibonacci Retracements as shown below.
|
|---|
|
|---|
To start, we can use the EMA (Exponential Moving Average) to help us identify trends in the market, i.e., looking out for Golden and Death crosses. Where when the shorter or faster EMA is above the longer or slower EMA (Golden Crossing), signalling a potential uptrend, and the shorter or faster EMA is below the longer or slower EMA (Death Crossing) indicating a potential downtrend. This can guide us on when to enter or exit a trade.
Next, we bring in Fibonacci retracements to identify potential support and resistance levels, with these levels acting as entry and exit points for our trades. For example, if the price retraces to a Fibonacci level after a trend, we might consider entering a trade when the EMA supports that decision by signalling a Golden crossing. Below shows what we get when we combine both indicators.
 |
|---|
Therefore, when it comes to entering a position, we look for the meeting point of these two signals. For instance, if the EMA shows a Golden Crossing, and it retraces to a key Fibonacci level, as shown in the image above the point marked Golden Cross (GC) in green and where the Retracement is on support level 2 (S2) as that could be a good entry point for a buy order. On the other hand, if the EMA shows a Death Crossing and the price struggles to break a Fibonacci resistance level as shown in the image above, the point marked Death Cross (DC) in blue and where the Retracement is on Resistance level 1 (R1), as that could be a good entry point for a sell order. But then as these trades moves closer to Resistance level 1 (R1) for the Buy order and Support level 2 (S2) for the Sell order respectively, it might be a sign to exit these trades and take profit.
For risk management, we would need to set stop-loss orders below key support levels identified by Fibonacci or EMA to limit potential losses. Additionally, we could use Fibonacci extensions to identify potential profit targets.
Therefore, by combining both EMA (for trend identification) and Fibonacci retracements (for support and resistance levels), we can create a strategy that helps us make informed decisions on when to enter, exit, and manage risks in our trades because just like cooking needs us to get the right mix of our ingredient to have a successful dish; blending both EMA and Fibonacci levels can help us in making informed trading decisions.
Analyze a historical trading chart of STEEM/USDT pair where a 'Golden Cross' followed by a Fibonacci application led to a significant price movement. Explain how you would have negotiated this scenario. |
|---|
Now let's apply all we've learned today to our dear STEEM analysis. Below is the STEEM/USDT chart under 1-Day time frame with both Golden and Death Crosses with Fibonacci Retracements applied.
 |
|---|
From the screenshot above we can see that Steem is on an upward trend by just taking of from the second support level and heading towards the first resistance (R1) just after a Golden Crossing in dictating that an upward trend is on sight. Therefore is it overcomes the first resistance level, which is at 0.3026, it becomes our support and we look to take profit by the next resistance (R2) which is at 0.3253, and if it surpasses that as well, our focus is shifted to Resistance 3 (R3) at 0.3534
Therefore, I will need to enter a buy order at the moment of the Golden Crossing where the price is seated right at the second support level and hope to take profit somewhere around 0.3248 since the resistance (R2) is at 0.3253.
 |  |
|---|
Again, seeing how good the market is, I could sell half of my position at the point of Resistance (R2) and trail the other half using the Moving Averages where I get to hold onto the remaining half till the market breaks and closes below the moving average.
CONCLUSION |
In conclusion, the Fibonacci Retracements, EMA, Golden and Death Crosses can act as a guide helping traders to pick out potential turning points in the market to make better entry and exit points, which can lead better chances of profitability. However, it's important to know that these tools are not fail-proof, hence the need to have a risk management plan such as Stop loss.
I wish to invite @starrchris, @ngoenyi, @chants and @hamzayousafzai.
Thank You for your Time
NOTE: Always have a smile on your face, as you are never fully dressed without one.

I really enjoyed going through your comprehensive description of every point and that with analogies to make it easily understandable.
I like how you compared the SMA to a smoothie. It makes it easy to understand how it smooths out price fluctuations over a period of days. This analogy helps beginners grasp the concept quickly and visualize how SMA averages out the highs and lows in price, providing a clearer trend.
This comparison of EMA to a high-tech smoothie is great. It clearly shows how EMA reacts faster to recent price changes by giving more importance to the latest data. This explanation is very effective in highlighting the key difference between SMA and EMA, emphasizing EMA's responsiveness.
I think describing EMA as a turbocharged tool is very effective. It highlights the EMA's ability to respond quickly to market changes, which can be crucial for traders looking to make timely decisions. This vivid description helps convey the advantage of using EMA for faster trend detection compared to SMA.
You have explained the Golden Cross clearly. It shows why traders think it means prices might go up, indicating a strong upward trend. Calling it a "special recipe for success" makes it easy to remember and highlights how important this crossover is for predicting rising markets.
Your explanation of Fibonacci Retracement levels is clear. It helps in understanding how these levels indicate potential support and resistance points, where prices might reverse or continue their trend. This is crucial for traders to make informed decisions about entry and exit points in their trades, enhancing their strategy.
All the best
TEAM BURN
Congratulations, your comment has been successfully curated by @kouba01 at 15%.
Upvoted! Thank you for supporting witness @jswit.
Congratulations! This comment has been upvoted through steemcurator04. We support quality posts, good comments anywhere, and any tags.
Very nice article. You explained the SMA and EMA concept well.
Thank you. I'm glad you found the explanations of SMA and EMA concepts clear. Understanding these tools can really enhance your trading strategies.
Greetings my friend @sahmie,
It's nice how you compared the SMA to a smoothie of prices , making it easy to grasp. The EMA as a turbocharged tool analogy is brilliant too !
I'm glad you liked the comparison of SMA to a smoothie of prices and EMA as a turbocharged tool. It's all about finding fun ways to explain these concepts so they're easier to understand.
They're many reasons i love ❣️ reading your post.
I always acquire new knowledge and expand my vocabulary.
I always get new tips and techniques strategies to handle things
And of course many more.
The way you really explain each terms and hint to easy learnable patterns such that even a beginner to the exchange market can understand the start and navigate as well.
Good luck sir and looking forward to reading more from you.
Wow! I'm over the moon hearing how you enjoy reading my post. It's fantastic that you're gaining new knowledge and strategies. I love sharing tips and making complex topics easy to understand, so I try my best to look for a relatable analogy for the complex aspects. I appreciate your support and can't wait to share more with you.
This is awesome because I will see you article is off very high standard and I really appreciate how you keep in a lot of your time just to make this content a successful one. Also you did so well in your analysis and the most interesting thing is that your chats are of high standard and they are very clear to their eyes off other viewers. This message is there for other content creators or other visitors to understand and go through article with is ease.
I'm glad you appreciate the effort. Your kind words mean a lot. It's essential to create content that's clear and engaging for everyone. Good luck to you too.