Cross-Asset Correlation Analysis
 |
|---|
INTRODUCTION |
Have you ever wondered if there is a tool or an analysis to measure how close two friends are in character, conduct and behaviour?
Or then, interested in how well two or more things like your snacks, food or friends go together? like how you need chilled water in hot weather or a soda to go with your pizza? Well in this week's topic, we are discussing how we can determine this in our cryptocurrency market between two or more cryptocurrencies. If you are interested, then get a seat and I hope you get to grasp something from the lesson.
Explain the concept of cross-asset correlation and its significance in portfolio management. How does understanding correlations between different cryptocurrency assets contribute to effective diversification strategies? |
|---|
Before we go into the topic of the day, let's look into the simple meaning of the various terms, shall we?
Cross-Asset
Cross-asset simply refers to the idea of looking at two or more types of investments all together. It simply means having or looking into a mix of different assets, such as stocks, bonds, and maybe even real estate or commodities. Hence we can say it is like having a buffet of investment options.
Correlation
Correlation in simple terms is like finding the friendship or enmity between two or more things. That is, it serves as a means to show how closely or separately they're connected or how they move together in the same direction or opposite direction.
Therefore, when two things have a positive correlation, it means that when one goes up, the other tends to go up too (the same direction), and when there's a negative correlation, it means that when one goes up, the other tends to go down (opposite direction).
That is, correlation shows whether two or more things are either best buddies or frenemies. This means that correlation helps us understand how different things relate to each other.
Now merging our previous two definitions, we can say that Cross-asset correlation is like finding connections between two or more types of assets or investments.
It's like seeing how different assets, like stocks, bonds, or real estate, move together. Therefore, when they have a positive cross-asset correlation, it means they tend to move in the same direction, and if they have a negative cross-asset correlation, it means they move in opposite directions. Hence this is like seeing if two or more assets are BFFs or not-so-friendly
 |
|---|
Therefore, Cross-asset correlation is super important in portfolio management as it helps us understand how different investments in our portfolio move together.
As we've already learnt above, if our assets have a high positive correlation, it means they tend to move in the same direction. Therefore, if one goes up, the others are likely to go up too. While, if our assets have a negative correlation, it means that they move in opposite directions.
Hence, Cross-asset correlation can help us diversify our portfolio and manage risks, in the sense that by having a mix of assets with different correlations, we can potentially reduce the impact of any single investment on our overall portfolio. It's like having a balanced team of investments to help us achieve our financial goals.
So understanding the concept of correlations between different cryptocurrencies is key to diversifying your investment strategy. It's like having a variety of crypto buddies in your portfolio. When cryptocurrencies have a high positive correlation, it means they tend to move in the same direction. So if one goes up, the others are likely to go up too. But if they have a negative correlation, it means they move in opposite directions.
By having a mix of cryptocurrencies with different correlations, you can potentially reduce the risk of relying on just one crypto. It's like spreading your crypto eggs (assets) across multiple baskets as diversification helps protect our investments and increases the chances of finding success in an ever-changing crypto world.
Explore how cross-asset correlations change during bullish and bearish market conditions. How can traders leverage this knowledge to adapt their portfolio strategies based on the overall market sentiment? |
|---|
During bullish market conditions, cross-asset correlations can change in interesting ways. It's like when everyone's feeling optimistic. In a bullish market, assets that usually move together might become more closely correlated. This can be likened to friends dancing to the same beat.
On the other hand, during bearish market conditions, things can get a bit more chaotic. Assets that were once closely correlated might start moving in different directions. It is like they are all doing their own dance moves.
Therefore, cross-asset correlations can shift during different market conditions, and it's important to keep an eye on those changes to make informed investment decisions.
So traders can use this knowledge of cross-asset correlations to adapt their portfolio strategies based on the overall market sentiment. When the market is feeling bullish and assets are moving together, traders might consider diversifying their portfolio by including assets that have a low correlation with the rest. This is like adding a unique flavour to your investment mix, and this can help reduce the risk of relying too heavily on one asset.
On the other hand, when the market is bearish and assets are moving in different directions, traders might focus on assets that have a negative correlation with the rest. It's like finding a counterbalance mechanism system to the market's moves.
Therefore, by understanding these correlations and adjusting their portfolios accordingly, traders can potentially navigate the market sentiment and make more informed investment decisions.
Explain how understanding cross-asset correlations can be utilized for effective risk management and portfolio diversification. Provide examples of how allocating assets with low or negative correlations can help mitigate overall portfolio risk. |
|---|
As I've previously stated, understanding cross-asset correlations can be super helpful for managing risks and diversifying your portfolio, because it is like having a safety net for your investments.
Therefore by knowing how different assets move together, we can spread our investments across a variety of assets that don't all move in the same direction. This way, if one asset goes down, others might go up or stay stable. It's like having a balanced team of investments.
This diversification can help reduce the impact of any single investment on your overall portfolio. So, by keeping an eye on those correlations, you can make smart choices to manage risks and increase the chances of success in the long run.
For Example, let us say I have some cryptocurrencies in my portfolio and knowing that they can be quite volatile, for me to mitigate the risk, I can also allocate some real estate investments because real estate is believed to have a low correlation with cryptocurrencies. This way if the crypto market goes through a rough patch, my real estate investments might provide stability and I have successfully gathered a diversified team of investments that covers each other's weaknesses.
By including assets with low or negative correlations, I have successfully spread out the risk and made my portfolio more resilient.
Explore the historical correlation patterns between STEEM and other major cryptocurrencies, such as Bitcoin and Ethereum. How have these correlations evolved, and what insights can traders draw from STEEM's behaviour about the broader market? |
|---|
Correlation between two or more assets is measured in a coefficient known as the correlation coefficient. The correlation coefficient is a measure that tells us how closely two variables are related. It usually ranges from -1 to 1.
A correlation coefficient of 1 means a perfect positive relationship, where the variables move in the same direction.
A correlation coefficient of -1 means a perfect negative relationship, where the variables move in opposite directions.
A correlation coefficient of 0 means no relationship between the variables. It's like a way to quantify how well two things go together.
To calculate the correlation coefficient between two or more assets, you can follow a simple process.
Step 1: Gather the historical data of the assets, I.e., their prices or returns, over a specific period.
Step 2: After gatherings their historical data, we can calculate the coefficient using EXCEL or GOOGLE SPREADSHEET
Step 3: We can also compare how they move together. I.e., if they tend to move in the same direction, meaning a positive correlation, and if they move in opposite directions, it means a negative correlation.
However, to carry out this exercise I will be sharing 3 different ways to calculate the coefficients STEEM and BTC using GOOGLE SPREADSHEET and 2 more convenient ways on TRADEVIEW.
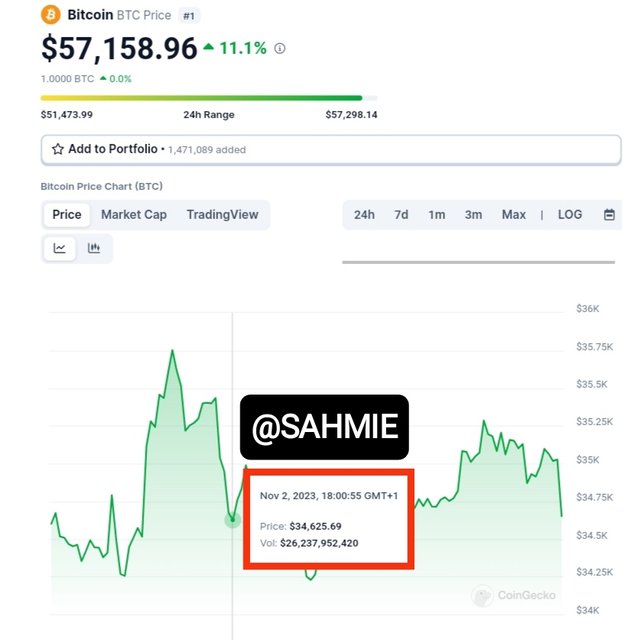
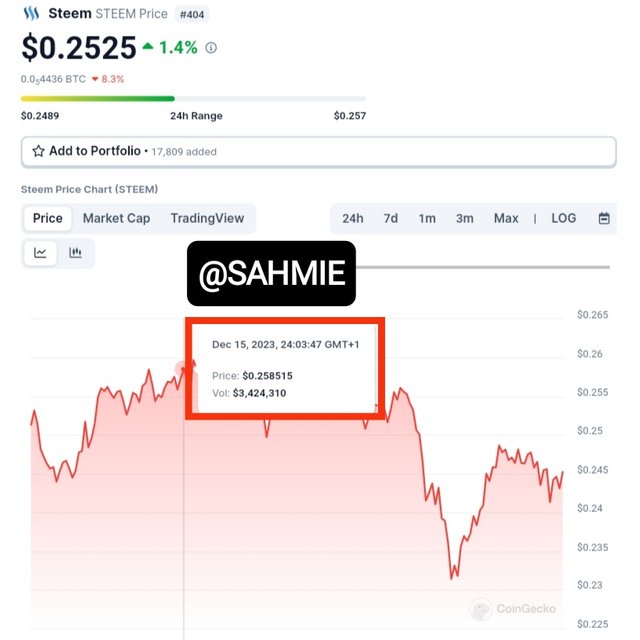
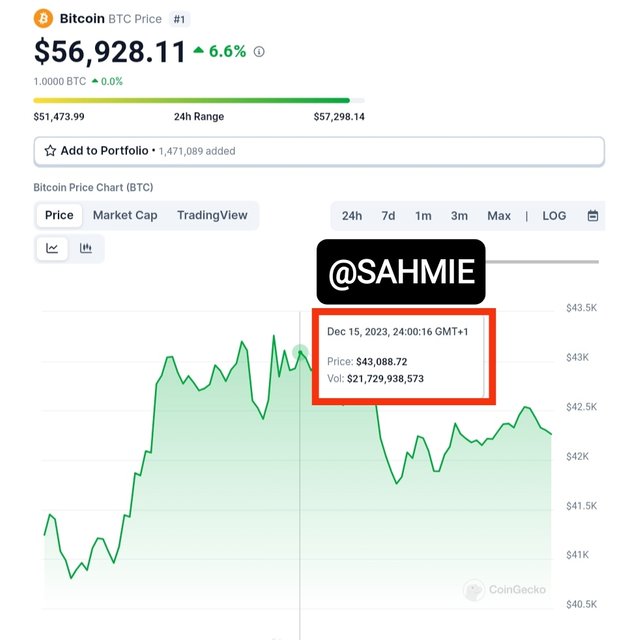
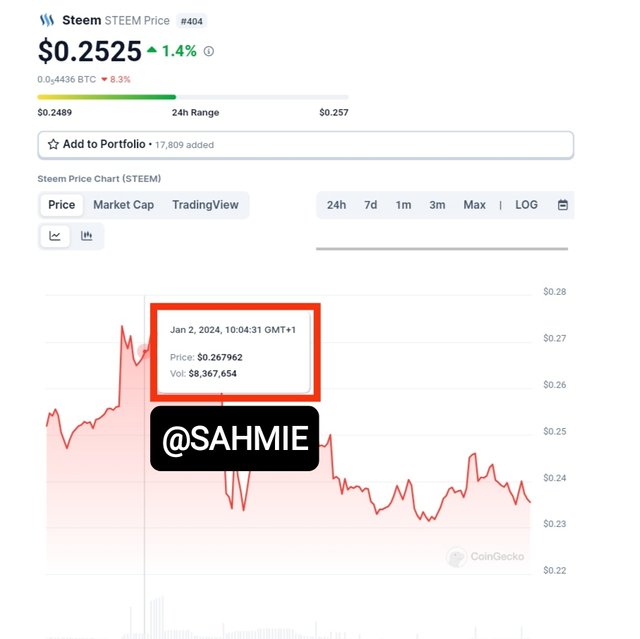
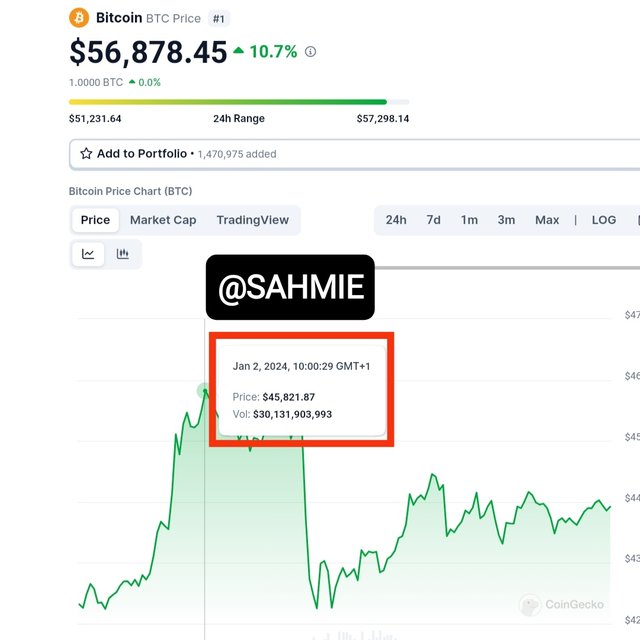
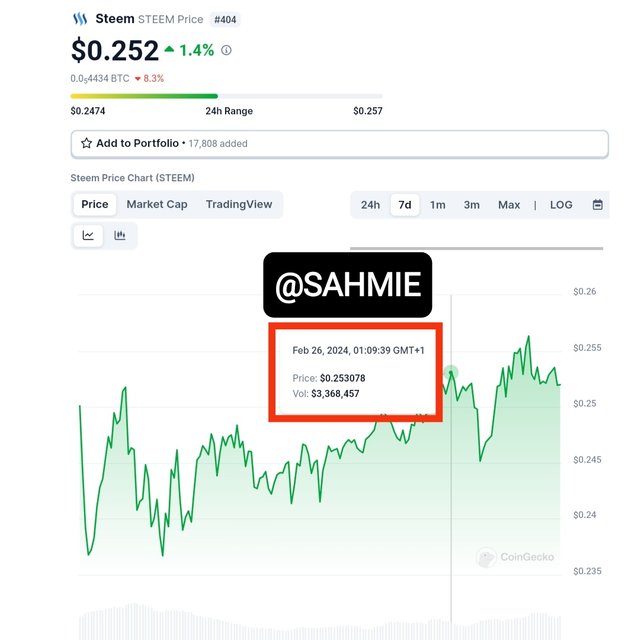
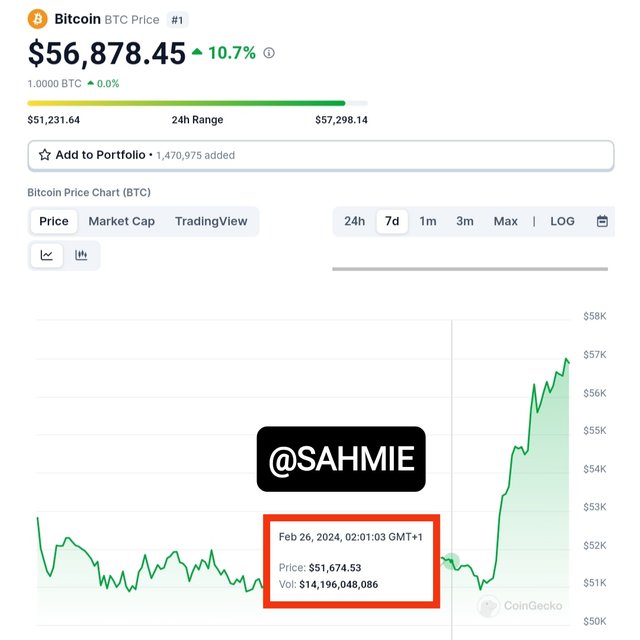
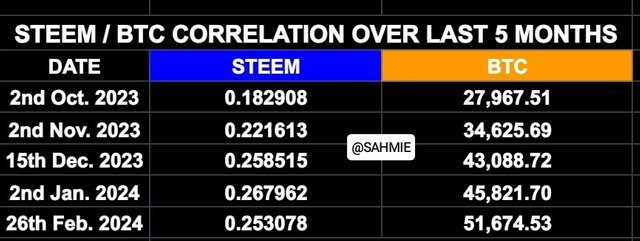
Step 1: To do this, I have collected historical price data for both STEEM and BTC for the past 5 months on the same dates and approximately the same time intervals as presented below.
| Date | ||
|---|---|---|
| Oct. 2 | ||
| Nov. 2 | ||
| Dec. 15 | ||
| Jan. 2 | ||
| Feb. 26 |
All figures where gotten from the images below.
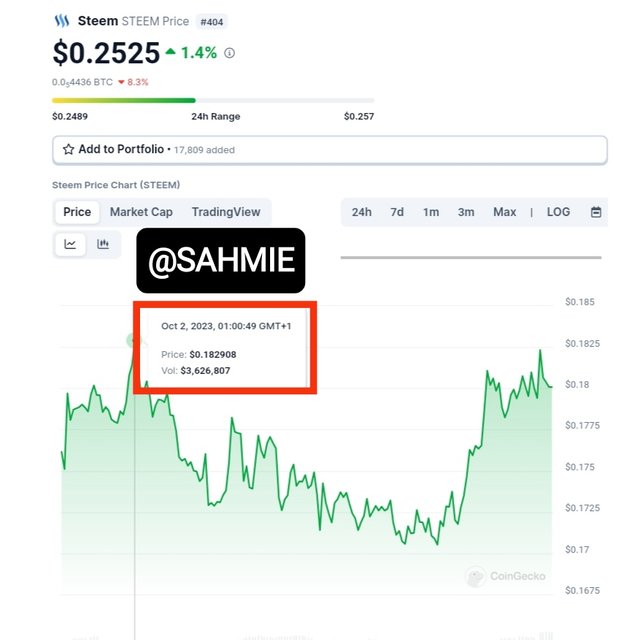 | 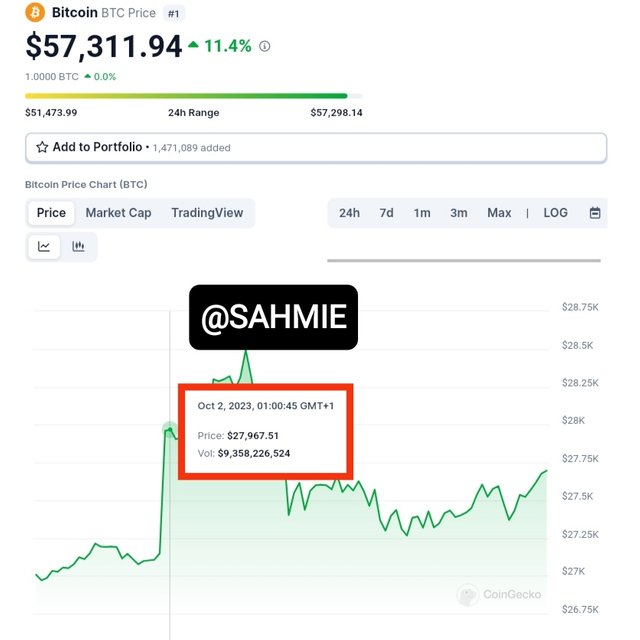 |
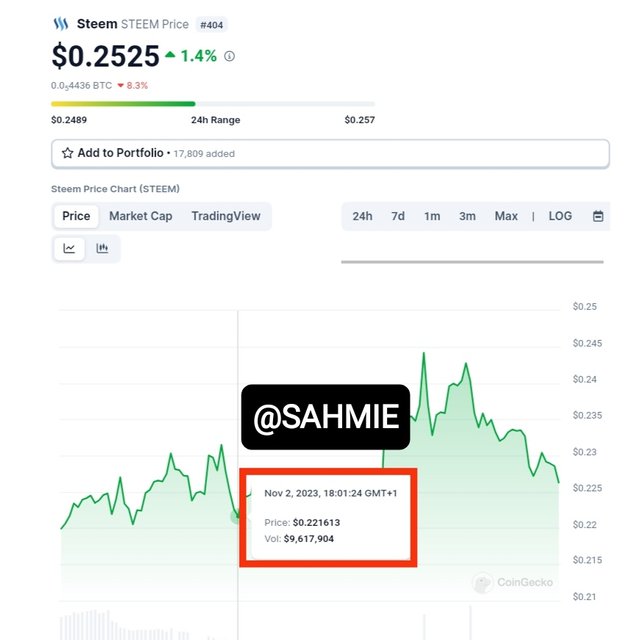 |  |
 |  |
 |  |
 |  |
Step 2: I opened my Google Spreadsheet App and fixed these values.
 |
|---|
Step 3: On an empty Cell, I input the correlation formula and the variables into the brackets provided as shown below.
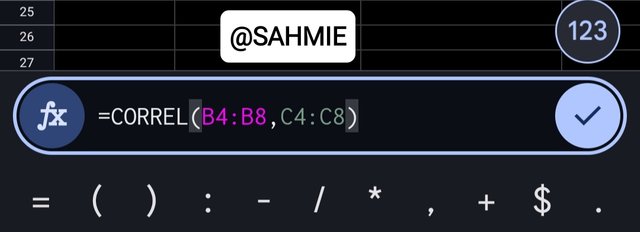 |
|---|
Step 4: The Spreadsheet calculated the correlation and gave me the correlation coefficient as 0.8958324084 as shown below.
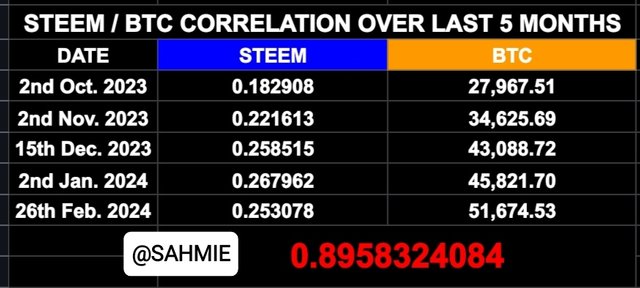 |
|---|
The Correlation coefficient gotten from our calculations using the Google sheet above which is ~0.895 shows that STEEM and BTC are closely related, more like the best of friends because 0.896 is closer to 1 than 0 and -1. This means that, any changes on BTC will also affect STEEM. That is, if the price of BTC goes upward, then STEEM is also expected to follow the same trend and vice visa.
Step 1: Open the TradeView Home page and type in BTC on the search box and select BTCUSDT from the results to open the chart.
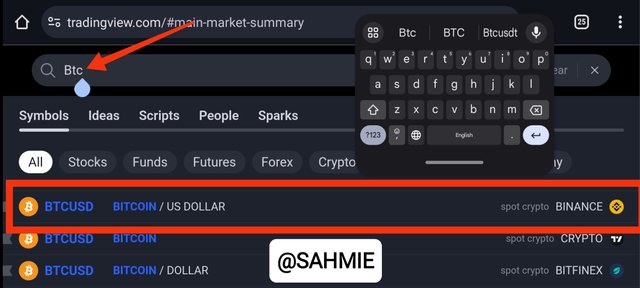
Step 2: On the opened chart, click on the "+" button at the top left.
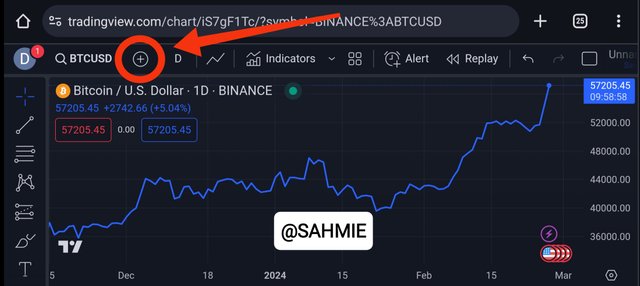
Step 3: On the search box, type in STEEM and select STEEM/USDT from the results given.
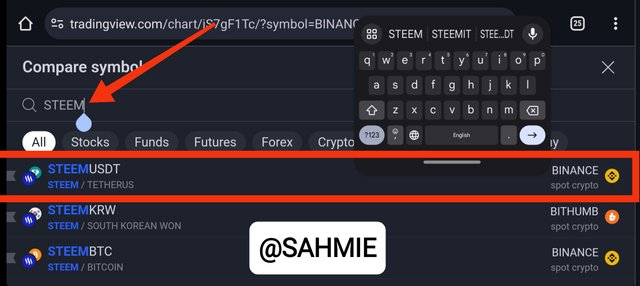
Step 4: On the STEEM/USDT result bar, click on "SAME % SCALE" to compare the two assets.
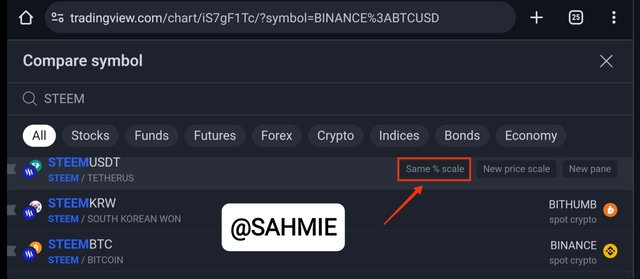
Step 5: Then the chart displaying both assets on the same % scale will be displayed as shown below, with the Bitcoin in Blue colour and STEEM in Orange colour.
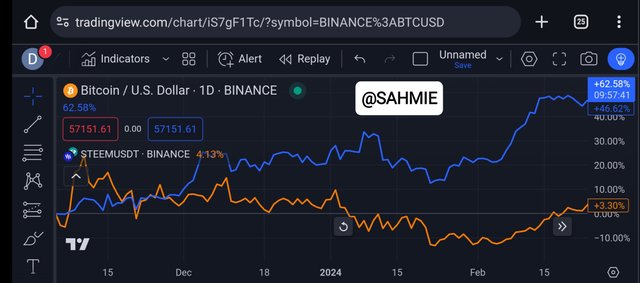
From the above screenshot, we can see that BTC (in Blue colour) and STEEM (in Orange colour) are very related in every step of the way as shown below.
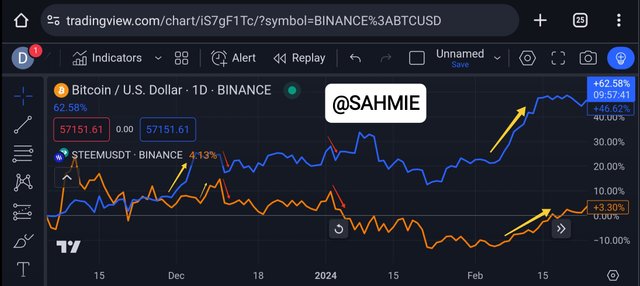
From the screenshot above we can see that BTC (Blue line) and STEEM (Orange line) are best of friends, where I've marked out in Red arrows where BTC experienced a downward trend and STEEM followed suit. On the other hand, in the yellow arrows showing where BTC experienced upward trends and the STEEM followed the same direction.
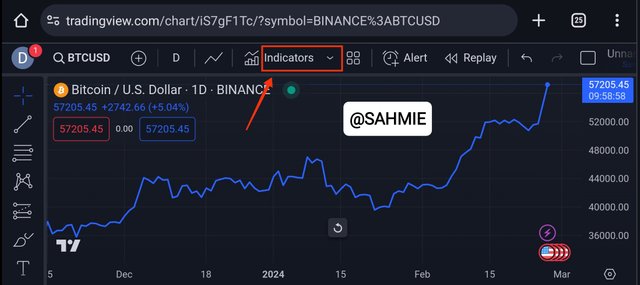
Step 1: On the open BTC/USDT chart, click on the indicator button at the top center.
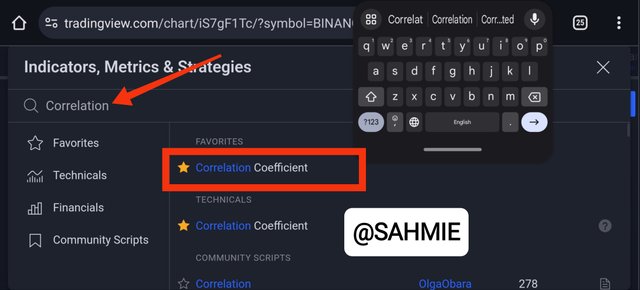
Step 2: Search for the correlation tool by typing "CORRELATION" into the search box and selecting the correlation coefficient from the results.
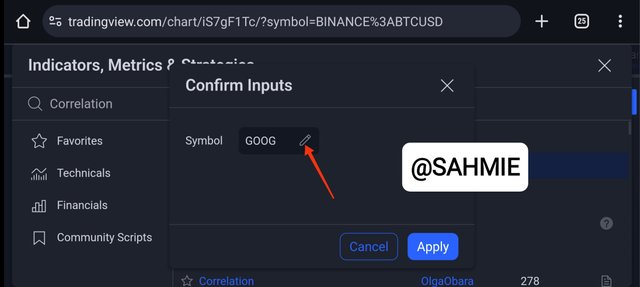
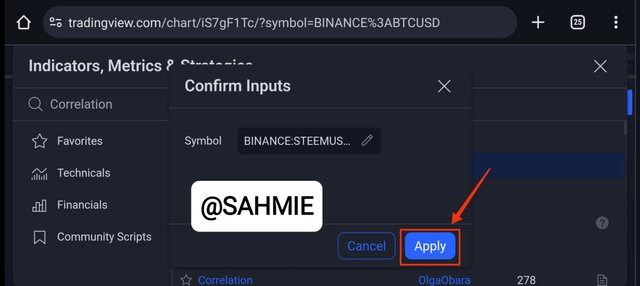
Step 3: On the confirm input window, click on the pencil to change GOOG, to STEEM.
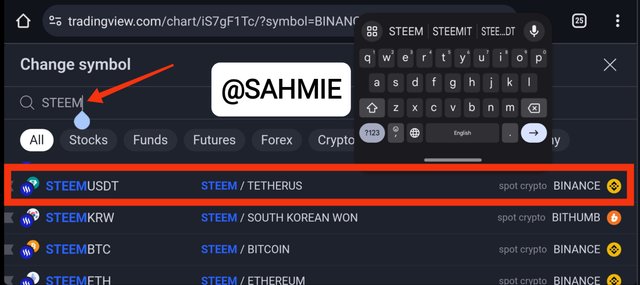
Step 4: In the search box, type in STEEM and select STEEM/USDT from the results.
Step 5: Then on the confirmation window, click "APPLY" to apply the indicator as shown below.
Step 6: Then The chart showing the BTC price movements and the graph showing the STEEM/BTC Correlation coefficient below will be shown as displayed below.
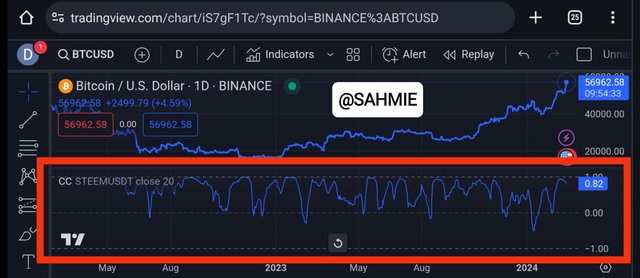
From the above screenshot, we can see that the relationship between STEEM and the BTC has always been a positive one (marked in green rectangle) from the beginning of the STEEM project till date, with only but a handful negative correlation (the red arrows) as shown below.
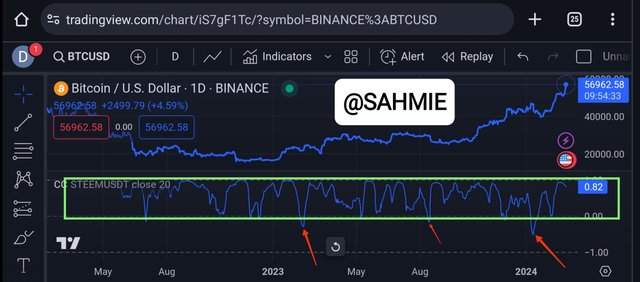
This shows that STEEM as always been in a strong relationship with the BTC as the correlation coefficient is as over 0 and mostly just barely below the 1 mark. And again, from the screenshot above we can see that the correlation coefficient is ~0.82 which also very close to our initial value calculated with the Google Sheets which gave us a value of ~0.896.
CONCLUSION |
In conclusion, understanding cross-asset correlation is crucial for building a well-diversified portfolio. By allocating assets with low or negative correlations, investors can mitigate overall portfolio risk, as correlation analysis allows us to identify how closely different assets move together, helping us make informed investment decisions. However, be warned that everything in this publication is for learning purposes and never financial or trading advice, hence make your research before embarking on your trading journey.
I wish to invite @starrchris, @ngoenyi, @chants and @hamzayousafzai.
Thank You for your Time
NOTE: Always have a smile on your face, as you are never fully dressed without one.

Wow that's outstanding and I think you have done fantastic job you are getting 10 out of 10 and then getting instant word I think that's your determination to this platform and your hard work to this platform.
I have seen you are working a lot and this is I think your hard work day and night hard work I learnt a lot I am from you especially in a Crypto related so I must say you are my teacher and when you have answer the question one I think the definition was very easy to understand in simple language.
And how you have explained the bully and and the bear is at market trends that's marvelous.
For me to understand as always difficult was the last questions so when I read the article you have written I think that's outstanding how you given the daily life examples I must say you have a lot of knowledge and you have done amazing job and keep shining as always and best of luck for this contest I know you are the winner as always because you always put a lot of efforts while writing any articles.
That was a wonderful read about the topic and as always full of crucial information. I always learn something new by reading your posts in this community. Thank you so much for such a detailed description of Cross-Asset Correlation.
I'm really glad you enjoyed reading about the topic. It's great to hear that you found the information in the post to be important and helpful. Your kind words mean a lot to me. I always do my best to provide detailed descriptions using the simplest of things around us so that everyone can learn something new. Thank you for your support and for being a part of this community.
Many thanks to @sahmie for publishing an article in your article in the Steemit Crypto Academy community. The cross-asset and correlation in your description is clear and easy to understand. The use of the comparative example of "best friend or foe" is effective in simplifying the theory.
Greetings friend,
Thank you so much for your kind words. I'm more than happy to hear that you found my article helpful. I tried my very best like always to explain the concept of cross-asset correlation in a clear and easy-to-understand way. Comparing it to a "best friend or foe" really helps simplify the theory. I appreciate your feedback and I'm happy to know that it resonated with you.
@sahmie Really enjoyed your comprehensive breakdown on cross-asset correlation in the crypto market. Your detailed analysis using Google Sheets and TradeView is super insightful. Loved how you applied it to STEEM/BTC - very practical. Wishing you the best of luck in the contest! Your knack for explaining complex concepts in a digestible way truly stands out. Looking forward to more of your content!
Greetings friend,
Thank you so much for your kind words. I'm more than happy to hear that you enjoyed my breakdown on cross-asset correlation in the crypto market. I tried to make it as comprehensive as possible and I'm glad it resonated with you. Using the Google Sheet and TradeView to analyze the data really helps provide valuable insights on both manual and automated levels. And I'm glad you found the application to STEEM/BTC practical. Your support means a lot to me and I appreciate your well wishes for the contest. I'll keep trying my very best to create content and participate in the given topics as much as I can by explaining each concepts in a very relatable way. Good luck to you too my friend.
hey brother your detailed exploration of cross-asset correlation in the cryptocurrency market is impressive. You've managed to break down complex concepts into easy-to-understand terms making it accessible for a wide audience. The use of relatable examples and analogies like comparing assets to friends and their dance moves adds a touch of simplicity that enhances comprehension.
Greetings my friend.
Thank you so much for your kind words, I'm really glad you found my exploration of cross-asset correlation in the cryptocurrency market impressive. I always try my best to break down complex concepts into simple terms that anyone can understand. It's all about making it accessible for a wider audience. And I'm happy to hear that the relatable examples and analogies, like comparing assets to friends and their dance moves, added that touch of simplicity and made it easier to grasp. Your support means a lot to me, and I'm grateful for your feedback.
Your post has been successfully curated by @𝐢𝐫𝐚𝐰𝐚𝐧𝐝𝐞𝐝𝐲 at 35%.
Thanks for setting your post to 25% for @null.
We invite you to continue publishing quality content. In this way, you could have the option of being selected in the weekly Top of our curation team.
Greetings friend @irawandedy, I very much appreciate your support. Thank you and have a pleasant day.
Hallo @sahmie
Penjelasan yang sangat detail, semoga harga steem meroket seiring dengan halving btc dibulan april ini
That's very true, since they are the best of friends from the onset. Therefore it's exciting to think about the potential impact of the BTC halving on the price of Steem. If this trend continues, it's possible that Steem could as well experience a positive effect. But then it is important to remember that the cryptocurrency market can be unpredictable, so it's always good to approach it with cautious optimism. Let's keep an eye on the developments and see what happens in April..
Hi friends... your explanation about cross-asset correlation is very extraordinary and interesting to read and easy to understand, you present the material very well and in detail along with examples. 👍👍👍.
Good luck friend.
Thank you so much for your kind words. I'm glad that you found my explanation about cross-asset correlation extraordinary and interesting. It's always my goal to make things easy to understand, so I'm happy that you found it clear with the examples I provided. Your support means a lot to me. Good luck to you too, my friend.
Upvoted! Thank you for supporting witness @jswit.