Steemit Crypto Academy Season 2-Week 8 | Cryptocurrency Trading with Bollinger Bands

Introduction :
We divide technical analysis indicators in the cryptocurrency market into two parts, which are the driving indicators that follow the price movement, which are indicators that are compatible with the strong trends of the financial markets. Indicators are the moving average indicator, in addition to the section of oscillating indicators, which are technical analysis indicators that depend on volatility to predict the upcoming price movement with high accuracy, such as the Relative Strength Index (RSI), in addition to the Bollinger Bands indicator.
Through this lesson, we will work to explain the trading indicator Bollinger Bands in the cryptocurrency market, where we will explain its components and method of calculation, in addition to that we will present how to trade using it, in order to suit all traders, whether they are professionals or beginners. Good reading !!
Bollinger Bands: What is it and how does it work?
Developed by the famous John Bollinger, Bollinger Bands have become one of the essential tools of technical analysis. Bollinger Bands allow a moving average of a security to be wrapped between two bands serving as both support, resistance, and/or trend indicator. They can thus be likened to a channel. Bollinger Bands use a moving average price as well as the volatility of that same moving average.
Simple to understand and to construct, Bollinger bands quickly established themselves as one of the most interesting chartist analysis tools to study. Of course, they do not in any way predict the future with accuracy, but they do allow us to estimate its possibilities.
- Formula or method of calculating the Bollinger Bands indicator
Before building the envelope, it is necessary to calculate the moving average of the security to be studied. Achieving a moving average is relatively straightforward.
Moving Average = Sum of prices over x days/number of days
John Bollinger advocates the use of a 20-day moving average, although it is possible to use other moving averages (10-50 days).
Once the moving average of the security is calculated, Bollinger Bands can be achieved. These use the volatility (standard deviation) of the moving average. The higher the volatility of the stock, the further the bands will move apart and thus indicate a clear trend in the stock. There are two bands, one upper and one lower.
- The upper band is calculated by adding to the moving average, 2 standard deviations.
- The lower band is calculated by subtracting from the moving average, 2 standard deviations.
Note that we use 2 standard deviations because this is a 20-day moving average. A 10-day moving average will require 1.5 standard deviations, and a 50-day moving average will require 2.5 standard deviations.
Once the moving average and the two bands are calculated, it is then very easy to draw them.
- Representation of the Bollinger Bands indicator
On the Ethereum / USD chart below, we have added the Bollinger Bands.
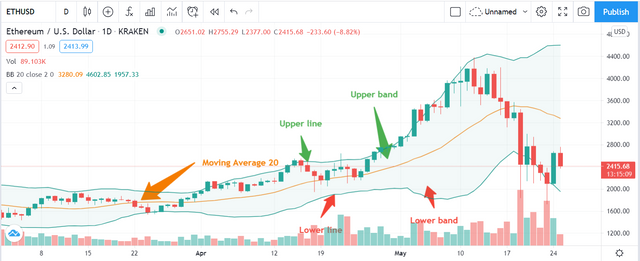
Bollinger bands are formed by 3 lines. A central line (in orange) and two lines, lower and upper. The centerline is a simple moving average.
You can see from the chart that the price action is oscillating between the lower and upper bands and that the majority of candles are contained in these bands.
First, Bollinger bands allow you to clearly see the ups and downs of the market. This is because the peaks touch the upper line of the indicator, and the troughs touch its lower line. However, you will be able to discover less obvious uses which will allow you to determine the volatility and the strength of the trend.
Interpretation of the Bollinger Bands Indicator in cypto trading :
- Measurement of volatility and Breakout :
Bollinger bands are an indicator of volatility. They can spot the increase or decrease in the volatility of any asset, including cryptocurrency currency pairs. When the bands widen, it means that volatility increases. Conversely, as they shrink, volatility decreases.
The Tron chart below illustrates the behavior of Bollinger Bands vis-à-vis volatility. In March, the bands were quite thin, a sign that volatility is low in the market. At the beginning of April, the downward breakout followed by the drop in the price of Tron increases market volatility. The bands widen accordingly.
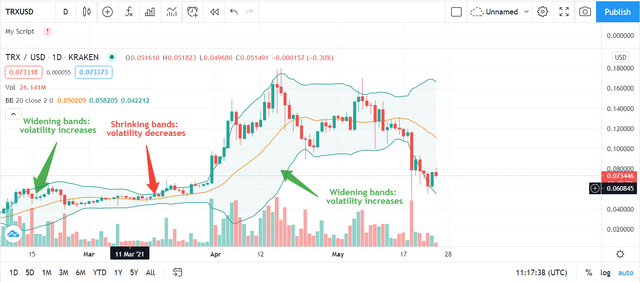
When the bands narrow to the point of becoming very thin, it signals low volatility in the market. It also heralds a potentially violent breakout. This breakout is often the result of news in the markets.
Indeed, in traditional markets, it is not uncommon for investors to reduce the size of their positions or not trade, pending major economic news. This decrease in trading volume significantly reduces market volatility.
And when the breakout comes, the price comes completely out of the Bollinger Bands which then start to widen again.
Therefore, when the Bollinger bands are very thin, traders are on the lookout for breakout trading opportunities.
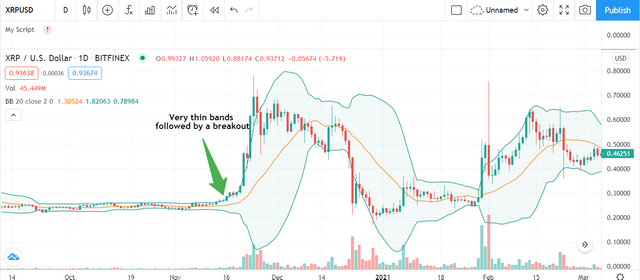
On the Ripple chart above, you can see this phenomenon. The bands got very thin just before the breakout, which was followed by an uptrend.
-Trend reversal :
Bollinger bands can help you spot market reversals or trend changes. This is because when volatility increases dramatically, the price comes out of the bars after the breakout. If more than one candlestick is formed on the outside of the bands, the first candle returning to the bars indicates a possible reversal in the trend.
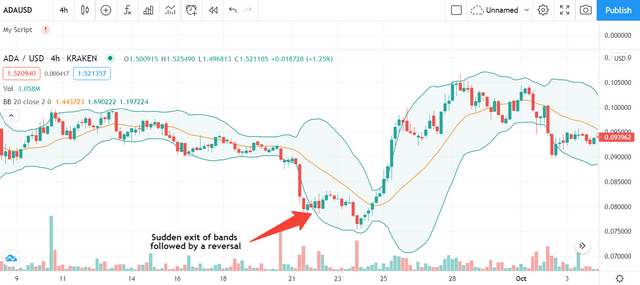
The chart above shows that Cardano's price completely breaks through the bands and forms several candles outside of it. The return of price action in the bars indicates a trend reversal. Note, however, that this signal conflicts with the market's direction. Therefore, one must negotiate with caution.
Overbought and Oversold
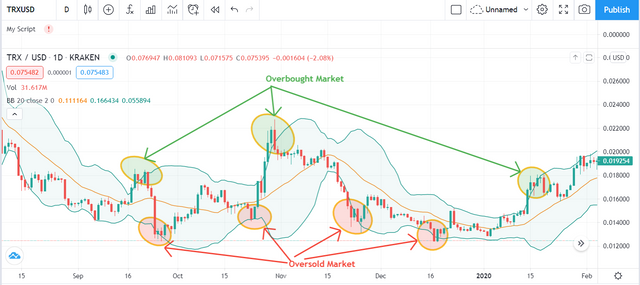
The Bollinger Bands indicator is also used to determine the overbought and oversold areas in the market. But it is important to note that this operates in a relatively calm and diversified market.
- Overbought
An asset is considered overbought when it is trading at sufficiently high prices. This can be determined using the Bollinger Bands. When price touches the upper line while bands have a relatively normal spread, the market is considered to be overbought. So traders can start selling or making their profits (for buyers). Price action tends to pull back to the central moving average or even the bottom line of the slides.
- Oversold
Conversely, an asset is considered oversold when it is trading at relatively low prices. Analysts can use ranges to identify selling areas on their chart. In fact, when price action touches the lower line of the range, it is considered that the market is oversold. In this case, the sellers can start to reduce the position size or take their profit. On the other hand, other traders see this as a buy signal.
Price retracement of the upper and lower lines can give powerful trading signals when combined with candlestick patterns such as hammers or spinning tops.
- Determination of the market trend
Bollinger bands are a quick way to see the market trend, like moving averages. The bands are more visual than a simple moving average line. In addition, the moving average can generate false reversal signals, when the price moves below or above the indicator.
Bollinger bands on the other hand envelop the price and give a better overview of the underlying market trend. Determining this trend is a snap! When the bands go up, the trend is up, and when they go down, the trend is down.
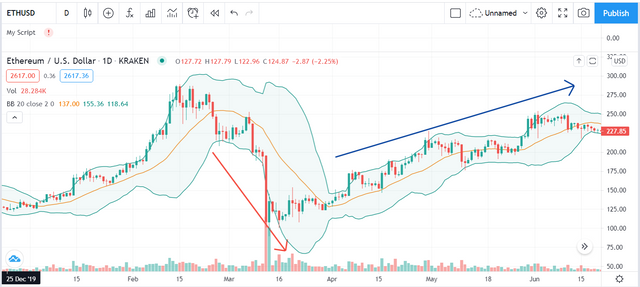
Bollinger Bands highlight the bullish and bearish trends on the chart above. At first, they move upwards, then after the Ethereum breakout downwards, the bands have reversed.
In a sustained trend, the central moving average of the Bollinger bands can act as dynamic support and resistance. In an uptrend, the rebound of the price on this central line offers traders opportunities to buy in the direction of the trend.
In a downtrend, bounces off the 20 moving average provide opportunities to sell in the direction of the trend.
Support and Resistance
Bollinger bands can be used in conjunction with other analytical tools such as fixed supports and resistances defined by price action. Indeed, the rebound of the ends of the bands can coincide with a support or a resistance already defined.
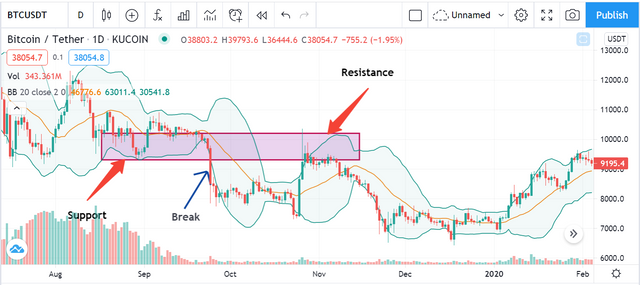
Going back to our 1-day chart on the Bitcoin / USDT pair, we notice that the first two rebounds on the upper line indeed coincide with a resistance that was support before the BTC / USDT price break.
How to set up Bollinger Bands?
The default parameters generally programmed in the trading platform, the number of periods over which the central moving average is calculated is 20 while the standard deviation which makes it possible to define the values of the upper and lower bands is multiplied by 2.
It turns out that with this type of setting, statistics show that in most cases prices should stay within these bands.
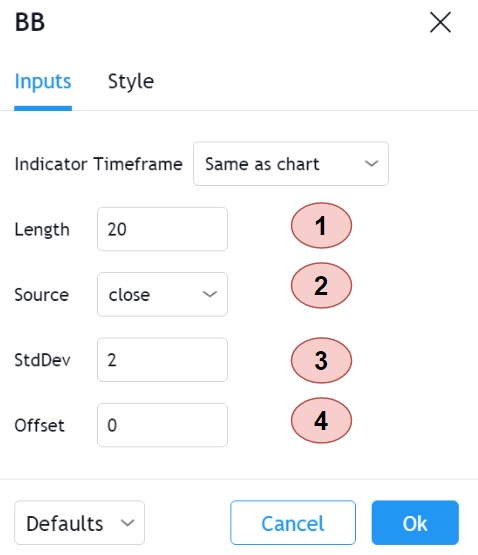
1- Lenght: By default, it is 20 which means the last 20 candles.
2- Source: Close: It means that we use the closing price of the candle to calculate the moving average
3- StdDev: By default, it is 2 which means twice the standard deviation, but you could put 50 in periods and 2.5 in standard deviation, which would mean 2 and a half times the standard deviation for the spacing of the bands.
4- Offset: By default, it is 0 which means the number of candles ahead of the graph, it is not very useful.
Advantages and disadvantages of the Bollinge bands indicator
Pros:
- Identifies the phases of lateralization (horizontal channels)
- Identifies the start of a new trend with an increase in volatility
- Allows you to simply follow the volatility of a security
Cons:
- Only one indicator remains
- Does not identify the causes of the change in volatility
Conclusion :
Bollinger bands are similar to moving average envelopes but are plotted at standard deviation levels above and below a moving average.
Bollinger bands are subject to several interpretations in terms of their possibilities and the way traders use them.
For example, they can be used as a "mean reversion" indicator to show if the price might be overvalued one way or the other.
In another case, they could be interpreted as an indicator of trend following and end of the trend when prices move outside the envelopes and they close below or above thus indicating the "break" of the tendance.
Bollinger bands can also clearly represent current market volatility, with contracted Bollinger bands indicating low volatility (with the possibility of a breakout) and wide bands indicating high volatility (with the possibility of a period followed by a breakout). 'low volatility).
Bollinger bands are not designed to be used on their own.
How they are interpreted on a chart depends a lot on the trader.
Homework Task 8 :
- Define the Bollinger Bands indicator by explaining its calculation method, how does it work? and what is the best Bollinger Band setup?
- What is a breakout and how do you determine it? (Screenshot required)
- How to use Bollinger bands with a trending market? (screenshot required)
- What is the best indicator to use with Bollinger Bands to make your trade more meaningful? (Screenshot required) (Screenshot required)
- What timeframe does the Bollinger Bands work best on?And why? (Screenshots required)
- Review the chart of any pair and present the various signals giving by the indicator Bollinger Bands. (Screenshot required)
Rules :
Try to read the lesson and the assignments carefully before you start editing.
You must write an essay that contains at least 300 words.
Make sure that you post your homework into the SteemitCryptoAcademy community.
Use copyright-free images with mention of its source, if possible, produce your own.
Plagiarism is forbidden in Steemit Crypto Academy, and its perpetrators may face serious penalties.
This homework assignment will run until 5th June'2021, Time- 11:59 PM UTC.
Include in your post among the first five hashtags #kouba-s2week8 and #cryptoacademy.
For users who are powering down, they will not be voted and considered excluded from participation.
Additionally, users with a reputation below 50 and/or haven't at least 150 SP in their wallet won't benefit from voting for their homework.

Cc:-
@steemitblog
@steemcurator01
@steemcurator02
Greetings Professor @kouba01. Another excellent task and a very good technical indicator as are the "Bollinger Bands", I will give my all to do a good job.
Financial Markets Analyst.
@lenonmc21
ADAX is an automated liquidity protocol that facilitates trades within the Cardano ecosystem in a completely decentralized and non-custodial way.
Check out the Website! https://adax.pro/ 😎
🗒For more question join their communities:
💥https://t.me/adaxcommunity
💥https://discord.com/invite/d4RWFryj
Total Supply: 100,000,000 ADAX, initial market cap $10M USD 😱💰
🔥 Initial Exchange Offering (IEO) (11th June 2021)
Hello, dear professor @kouba01,
Thanks for your lesson. It's indeed, a great one.
But here is what I do not understand
As in one of the comments you say that as you elaborate it as the best parameters to use to get the most accurate signals when trading? but as in this Bollinger bands, there are two parameters which are period and standard deviation. But I think you are talking about periods like in which period we can get the most accurate signals in trading, right? Like in 10 days, 20 days, or 50 days?
Thanks you
As the number of periods involved changes, you need to change the number of standard deviations used. You have to tell us how we do it and why? Is it according to trading strategy or randomly?
Oh okay, thank you.
Hello dear professor @kouba01,
Thanks for your lesson. Its indeed, a great one.
But here is what i do not understand
Do you mean"how to use BB with trading market or uptrend market"..
Please, i need a quick clue.
Thank you
@churchangel , It is the fact of following the movement of the market, upwards or downwards and to identify its beginning and its end.
Thank you so much sir. Its now very clear
Thankyou so much professor for this wonderful lecture on Bollinger band .
Hi prof below is the link to my homework
https://steemit.com/hive-108451/@tymes2/steemit-crypto-academy-season-2-week-8-homework-task-by-tymes2-cryptocurrency-trading-with-bollinger-bands
Hola estimado profesor @kouba01, excelente presentación del tema, muy interesante. Saludos.
gracias por tu aporte y experiencia
Hello professor @kouba01 please review my entry
https://steemit.com/hive-108451/@kingcent/steemcryptoacademy-week16-home-work-post-for-kouba01-currency-trading-with-bollinger-bands
Hello professor, it was really nice lecture and I have learned a lot, btw my last week Homework was not upvoted by sc02. Otherwise, this is my this week homework
https://steemit.com/hive-108451/@maazmoid123/season-2-week-8-or-cryptocurrency-trading-with-bollinger-bands
can I use dual time frame strategy? in time frame analysis??