STEEMCRYPTOACADEMY WEEK16, HOME-WORK POST FOR KOUBA01, CURRENCY TRADING WITH BOLLINGER BANDS.
Hello professor @Kouba01, thank you very much for this great lecture that you have rendered I really appreciate because I have really learnt alot.
Introduction
Define the Bollinger band indicator by explaining it's calculations, methods, and how it works? And what is the best Bollinger band set-up?
Definition of Bollinger band from my own point of view
Bollinger band can be defined as a concise technical analysis, it can also be an aparatus that is often used by various traders/investors to plot a two standard variations be it position+, or Negative-, apart from a mini moving average of Different prices and security but in this regard it can be adjusted by the user if you want, remember we are talking about adjusting the various prices and security.
Bollinger band came to lime-light as it was officially invented by a tactician called John Bollinger this particular technical analysis was designed for traders/investors that has a high gain in trading assets be it Oversold or overbought
Key points to Note
✓ Bollinger band is a technical aparatus which was invented by Mr John Bollinger it is used for bringing out the tendency of determining the oversold and overbought at any trading section
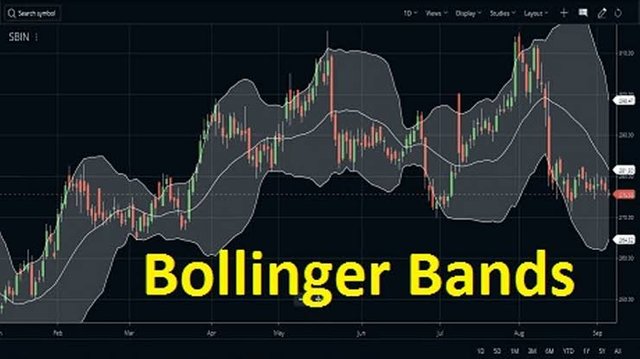
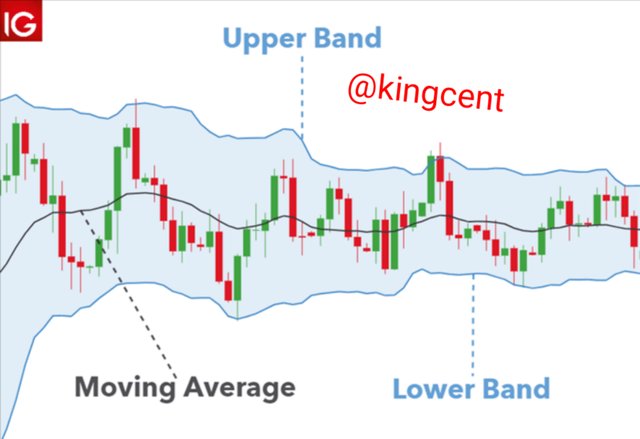
✓ in Bollinger band there are three lines, we have the one called the middle band, we have the upper band, and lastly we have the one called the lower band.
✓ the upper and lower band stands at two standard deviation, technically indicating a (+/-), starting from a 20- day, it can be ten day, too it depends thereby indicating a movement in the average, that's why I said it can be 10-day too. Average of 20 is 10 remember, but in this case it can be modified shall.
How to calculate Bollinger band
Before you think of calculating Bollinger band firstly you need to galvanize a linear moving average security structure, what that means is that you have to make use of a 20-day SMA, I earlier stated this, now it goes like this if you set up a 20-day transgressive linear average in respect to the climaxing prices for at least the initial 20-days prior to the first data point.
The next data point will then have a decline on the earliest price, if you now add the prices on the 21st day and then decides to collect the average, the so called the standard deviation of the initial security price will then be executed. Mathematically there has to be measurement of the simple average compliance and the various features this particular one is prominent, in tense of the various statistics, economics, stability, and the accounting structures.
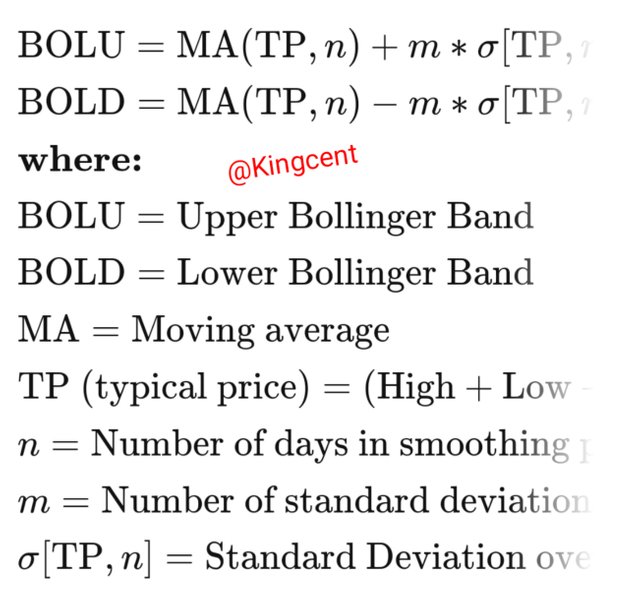
If you are given a complete set of data, your focus should be on the standard deviation measures, the way it tend to spread, should be considered also the average value given too.
then you will realize that the standard deviation can supply to be calculated, what you need to do is to take the square root of the variance therefore itself will then be the average of the supposed squared root difference of the mean. Mathematically is then involved here
Next thing you will do is to multiply the standard deviation the key value by 2, then do your addition and subtraction, subtract or add the amount from each point toward theSMA. They produce the different brands, the upper and the lower one.
How does it work
Due to thumb, different prices has teened overbought on the side whenever there is a touch in the upper band and the Oversold stretching to the down-side whenever they climax to the lower bands
As the price rotates between the various indicators upward or downward the extreme Bollinger band will then become a splendid aparatus to be ganged, there will be a high volatility whenever there is bands contracts there will be less volatility in the market.
This serves as a vital indicator to be used as a range bound strategy, onlike the Bollinger band it will just extend as the market get shaped to become super volatile, at this particular time Different investors or trader will deploy a breakout or a very vital trade based strategy.
What is the best Bollinger band setup, (metaTrader).
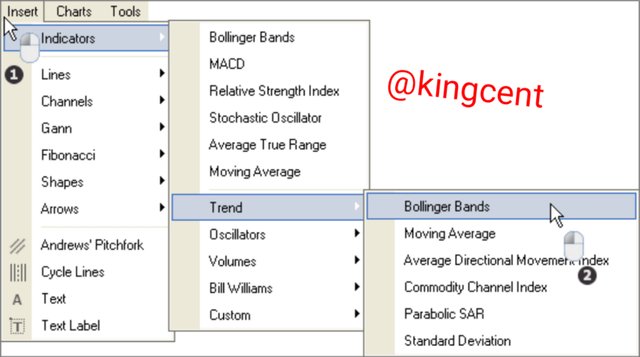
I will show how to set up Bollinger band in MetaTrader .
First of all open the Bollinger band indicator click on trend.
After clicking on it another page will come up where you will also click on Bollinger band.
Setting the parameters
After you are done with the first step another step is when the menu where you have the settings will appear.
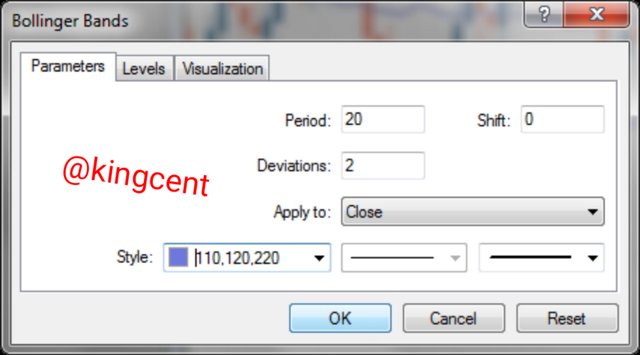
There are two mainly common known parameters
Calculations should be made on the indicators, e g there should be a setup regarding the amount of periods that is basically used for Bollinger bonds.
Visuality of an indicator for e.g, how it operates in this case the colour should be very much considered, and the view on the thickness of the various lines.
After setting up everything just as I have highlighted trading can kick start but there are some necessary things that needs to be put in place for effective trading strategy. A good trader needs a trading journal it will really help also the application of some codes will surely help too.
You can apply code like tradimo this can be applied during the checkout process by so doing you will get $30 off. Trading gets effective immediately this applications are all applied
What is a breakout and how do you determine it? (Screenshot required)
Definition
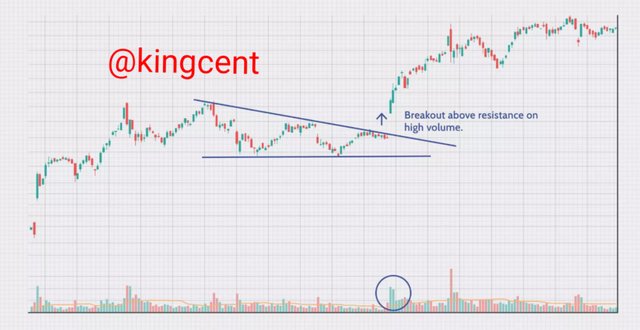
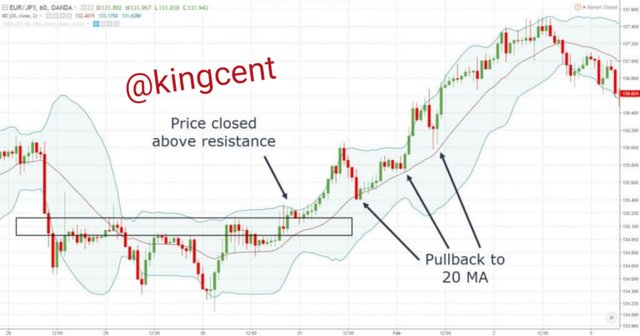
Breakout can be defined as a situation when the price of a commodity makes a twist move above a resistance arena, it then makes a move below a support area. Moving forward breakout indicates all important inclination that makes price to start trending in a particular direction.
Let's take for example,if a breakout is turned upside down starting from a chart pattern this could indicate that the price of assets will begin to trend much more higher,let's not forget that any breakout that happens on a higher volume,in respect to normal volume with greather conviction what this means is that the price of a commodity will most-likely trend toward a particular direction.
Key points to Note
A breakout refers to a situation when price of any assets climax and moves higher above a resistance level.
In some cases breakout tend to be subjective, remember not all investor makes use of then.
Breakout provides key trading opportunity for short and long term trading, and it also has traders to determine signals.
Breakout which has high volume indicates conviction, thereby making prices to move in a particular direction.
- Breakout has a low relative volume that has the tendency to failure, thereby the price of goods has a lower trend in a particular direction.
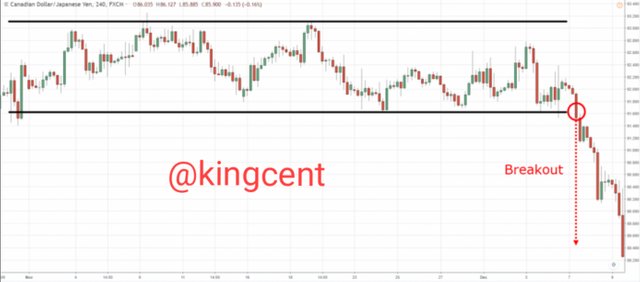
Example of a breakout
How do you determine it??
You determine breakout when the price transgress beyond some certain level, by so doing breakout what you need do is to enter your trade when the structure and the momentum is in your favour, please view some snap-shots below.
One of the benefit of trading breakout is that it gives you the opportunity to catch key trends in the financial market, that's the major reason many people makes use of it including trend followers. CTAs, and market wizards too.
When buying assets you are advised to buy when the assets you want to buy is on a low, because of you buy at a high price the market might reverse, the market itself is very volatile and in this situation you are condemed to loose.
How to use Bollinger band with a Trending market.
Bollinger band can be used in demostrating the various technical tools that can be used by so many Trend Traders who acquire exploit momentum. Fade traders will most-likely like to gain from a trending exhaustion or the reversal in question.
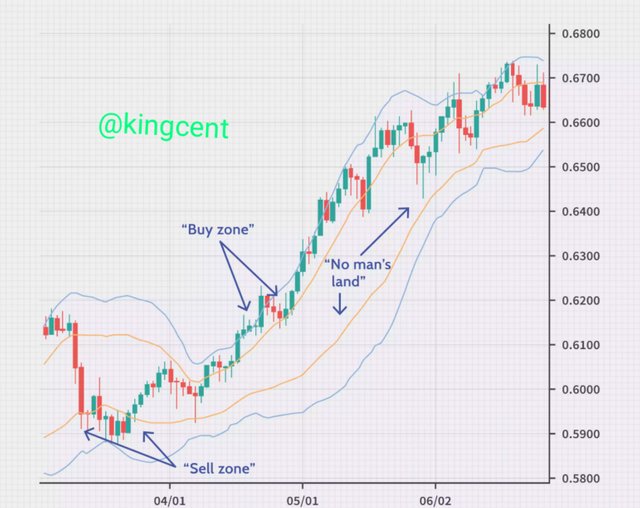
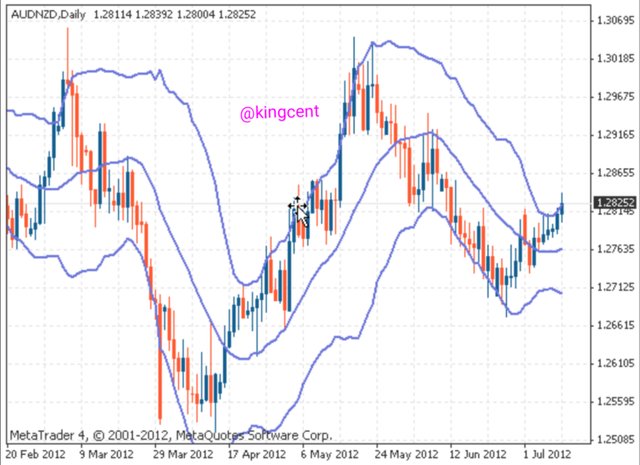
From the above chart you will see how price trend, you will also understand that different traders will position their long and short trades by entering the buy zone. By so doing they will be able to stake up a trade in the Bollinger band, most of the price will then be encapsulated.
You may know that the middle line in Bollinger band is 20-period it can't be over emphasize, the lines are moving average, As we all know it is called the mean of Bollinger band.
In a trending market, 20-period that is moving in average can be seen as an area of value what this particular one means is that when there is a pull-back toward the 20- MA, it will then serve as an opportunity for traders to gain, for example when the price bounce out of the 20-period moving average it will offer short trading opportunity.
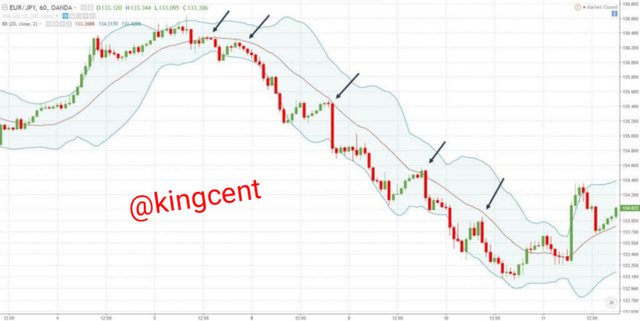
Another example
What is the best indicator to use with Bollinger Bands to make your trade more meaningful? (Screenshot required) (Screenshot required)
One thing you should understand is that Bollinger band helps analyst to determine different breakout in prices for any stock and more simple a trading range, Bollinger band assists in identifying volatility.
The band conjugates standard deviation to start a chart from the top to the bottom regarding the both side of the indicator. This was basically invented to working with Bollinger bands in order to assist make intense reference about different trends reversal and Different prices breakout, there are many indicators that are used by traders they are bandwidth and BB Trend both where all invented by John Bollinger.
Using bandwidth indicator
Bandwidth can be abriviated as BW it is used to measure the width of the desired band. The name explains the question in some ocassion, the band is related to the middle band, a platform of trades that is looked upon is known as the Bollinger squeeze this one is regarded as a narrow width which is caused by a miniature low voltage.
You can simply calculate squeeze by using this particular formula.
Top band (20-period)- lower band (20-period)÷ middle band(20 period)
source
You can easily see the squeeze on a chart, because the name indicates it, thereby looking like an upper and lower kind of band squeezing the middle band. Different traders makes use of this particular indicator as a signal to determining the insight signal from other indicators.
Note
Bandwidth is basically seen as a measure of the width of band that is relative to the middle band, Different traders makes use of it to detect Bollinger squeeze
What timeframe does the Bollinger Bands work best on?And why? (Screenshots required)
I will go with a multiple time frame, Bollinger band shows good assistance, and resistance, in order to enable traders to access the time frame easily, there are fantastic strategies that you can use to identify breakouts.
We will look at a chart here that will surely help is to add a great view into our trading capability, the time frame clearly shows a great insight on what is happening on the financial market.
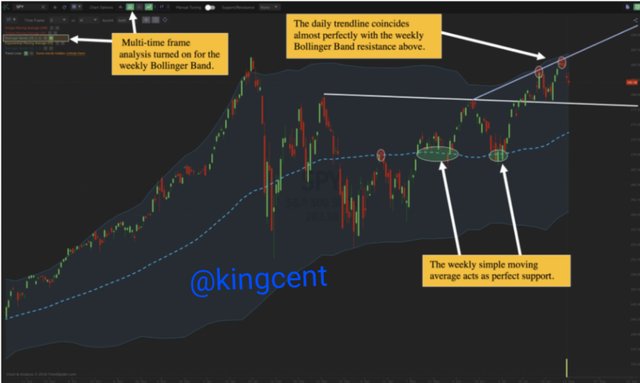
With Bollinger band trading normal curves are eminent in each time frame, by a concise standard deviation market look up. This will help specify the views in Bollinger bands.
Each time frame suites a particular trading style and Bollinger bands, a trade of 1 hour or 4 minutes or lesser chart has a key detail that is needed to accelerate trades.
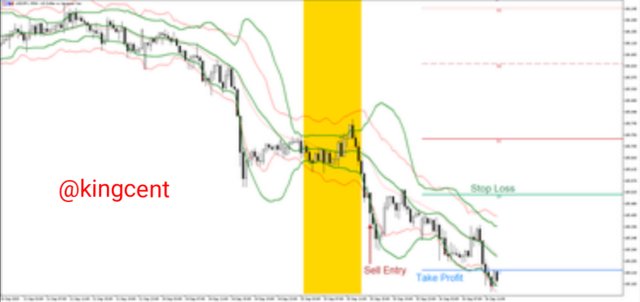
Review the chart of any pair and present the various signals giving by the indicator Bollinger Bands. (Screenshot required)
A buy trade is placed in a 5-10 below the Bollinger band, in the middle line, or below the pivot. The so called stop loss regarding the short trades are placed in a 5-10 pips ahead of the Bollinger bands lines, or over the closet pivot.
You can also calculate the pivot indicator by using the M30-Hi chart while for H4, and Do chart you can use a weekly pivot, you can change the two settings easily.
Conclusion
Thank you very much professor @Kouba01, this is a wonderful lectures presented by you trust me I really enjoyed your write-up thank you very much once again.
Cc:@kouba01
Please use the right hasthag kouba-s2week8
Thank you just changed it ....
Hello @kingcent,
Thank you for participating in the 8th Week Crypto Course in its second season and for your efforts to complete the suggested tasks, you deserve a 6.5/10 rating, according to the following scale:
My review :
An acceptable level article in which you tried to answer the questions clearly, but some points were lacking in-depth in the analysis, such as the last question, as we did not find any of the previously mentioned signals with the absence of follow-up of the pair's price movement and regarding Breakout point, you did not address the topic in the context of the Bollinger Bands indicator.
Thanks again for your effort, and we look forward to reading your next work.
Sincerely,@kouba01