Season 2-Week 8 | Cryptocurrency Trading with Bollinger Bands
Hello Everyone, so today I invite you all to read my today homework which I am going to make on Cryptocurrency Trading with Bollinger Bands subject which is given by Professor @kouba01.
So let us continue with our homework.
1. Define the Bollinger Bands indicator by explaining its calculation method, how does it work? and what is the best Bollinger Band setup?
Bollinger Bands indicator
Bollinger Bands Indicator is a technical indicator that helps traders in trading. And as the Professor has told us in the lecture the Bollinger bands indicator tool was developed by John Bollinger in 1980. And it was first made to use in the trading of stocks and now it is also used in the trading of Cryptos as well.
So the Bollinger Bands Indicator shows the volatility of the market which has a security price, with high and low as those are seen as Resistance and Support levels.
Bollinger Bands have consisted of three lines – the upper, middle, and lower band. The upper line one is called the upper band and the lower line is seen as the lower band. While the middle line is the middle band and is set by the traders.
Bollinger Bands Indicator takes an average of 20 days moving average and then made a possibility out of it as nobody knows the future but these indicators help in finding probabilities and possibilities of the market.
Bollinger Bands indicator calculation method acts something like this:
So this calculation method is to find the Moving Average
Moving Average = Sum of prices over x days/number of days
So here we first calculate the Moving Average, and as I already have told you all about that above that it is seen as a 20-day Moving average as it is advocated by John Bollinger, the father of Bollinger Bands. 20 is the default value while also can put 10 days of moving average and 50 days of Moving Average.
So when we will calculate the Moving average of security, we will get the Bollinger Band.
There is one more parameter in Bollinger Band which is Volatility or Standard Deviation, and as in default, it is 2 Standard deviation because we are using 20 days of Moving Average. but if we use 10 days of Moving average the Standard deviation will be 1.5 and if we use 50 days of moving average the standard deviation will be 2.5.
Note:
- 10 Days moving average is used for short term
- 20 Days moving average is used for medium-term
- 50 days moving average is used for long term
One more important thing in this is for the upper band we will have to add 2 standard deviations to the moving average and for the lower band, we will have to subtract 2 standard deviations to the moving average.
Best Bollinger Band setup:
So here I am gonna do the setup of the Bollinger band and will show that how to add the Bollinger band in the trading chart and the different periods and standard deviation.
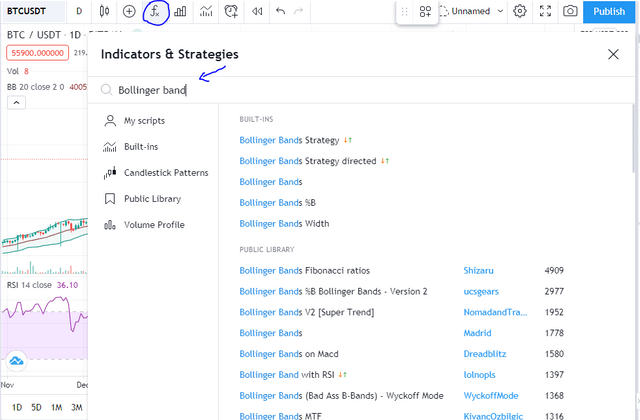
So I am gonna tell this from the Tradingview.com.
Here we will gonna click on fx and will type the indicator we want and as I want bollinger band so I clicked on that.
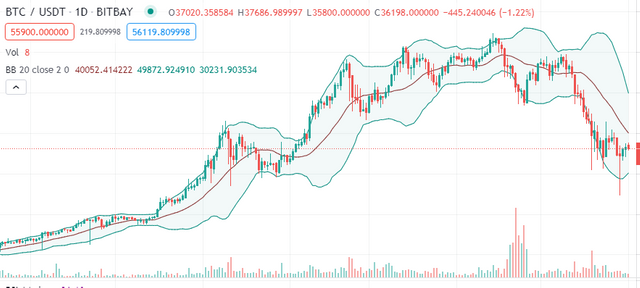
Now the chart is showing the Bollinger band indicator.
After that we will click on it's setting to set the periods and standard deviation
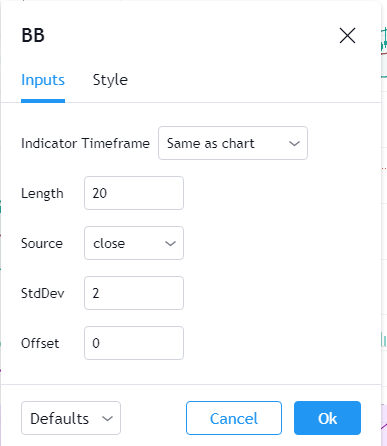
So here by default the length is 20 which is the moving average of Bollinger bands and the standard deviation is set to 2. And the source is set to close as the bands will be close to each other and the offset is 0 which is showing that the candles which are after the chart are not useful so that is why they are set to 0.
In the periods we also can put the period at 10 or 50 days moving average and with the 10 days moving average we will have to put 1.5 standard deviation which are the gap between the middle line and the other line. and with 50 days moving average we will have to put the standard deviation at 2.5.
»————————————————————————————————————✄
2. What is a breakout and how do you determine it?
Breakout in Bollinger bands is that when a candle go outside of the bands and the price closes outside the Bollinger bands. And in this situation the support and resistance level helps the trader that whether or not to buy and sell the asset.
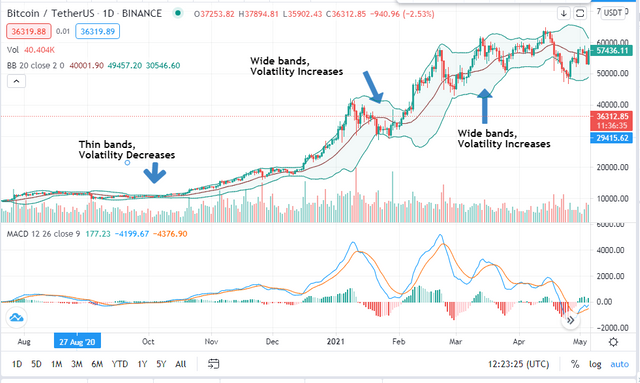
one more important part to see here is that Bollinger band is an indicator of volatility. So they are here to spot the Volatility in the market so if we see that when bands got fat or widen it means that the volatility is increasing but If the bands got thin that means that the volatility in the market is decreasing.
So as I here have choose the pair of BTC/USDT and there you can see that when the bands were widen the volatility increases and when the bands were thin the market volatility decreases. As you can see that till dec 2020 the bands where quite thin, so the volatility was normal that time but after that when the band got widen up the volatility of the market increases.
So usually when the volatility is low and the bands are thin, there are chances of breakout and as I have told you that in breakout the candles came outside of the bands and stop outside and the other 1 or 2 candles also made on outside so that is breakout and mostly became news as, it can take market to the bullish or a bearish point.
There are also two types of breakouts:
- The first one is when the candle stop outside the band but in resistance level.
- And the Second one is when the Candle stop outside the band but in support level.
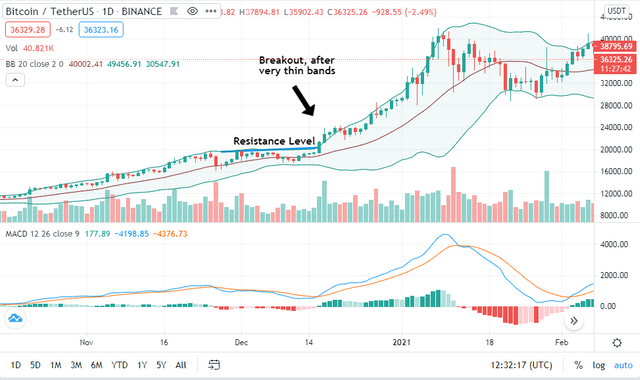
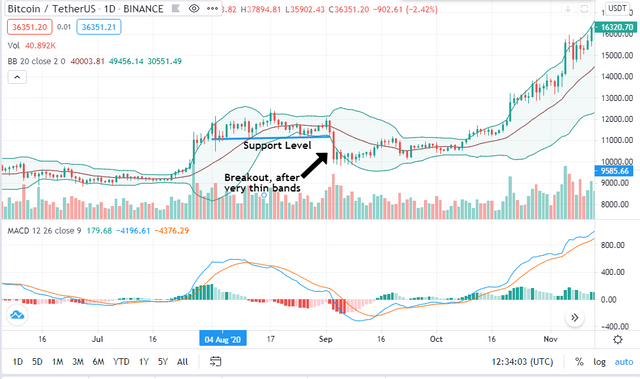
So in this BTC/USDT chart of the Tradingview you can see the both types of breakouts. Mostly the traders wait for the breakout which happens from the resistance point as from that they can earn some big profits.
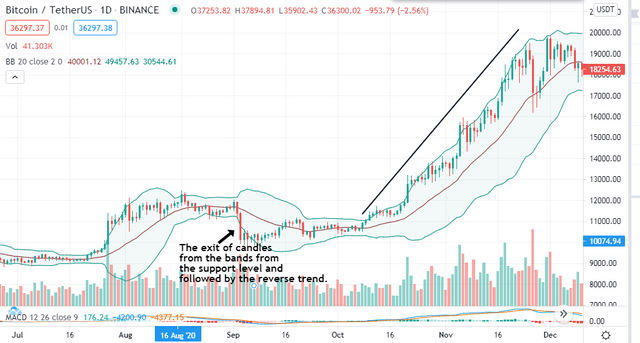
In the breakout we also have to undermine the Trend reversal, as sometime when the candle close outside the bands from the support level so mostly traders sell at that time, but sometimes the market can also get a trend reversal which the cause the market to go into bullish.
So the question is how we can find that? so mostly it is seen that when more than one candles closses out of the bands the trend reversal happens.
»————————————————————————————————————✄
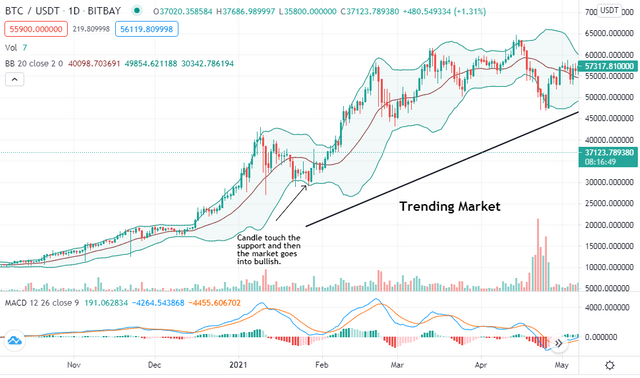
3. How to use Bollinger bands with a trending market?
So by the word trending market I learn that here we are talking about the market with wide bands of Bollinger bands, and sometime the market go up and sometime the market goes down, means in the trending market sometimes the market is in Uptrends and sometimes the market is in downtrend.
So it doesn't mean that we should jump into the trade instantly as sometimes the market remains in uptrend and sometimes the market remains in downtrend and that frustrates a trader and then the trader make mistakes. So one must have to see the market carefully before entering the market.
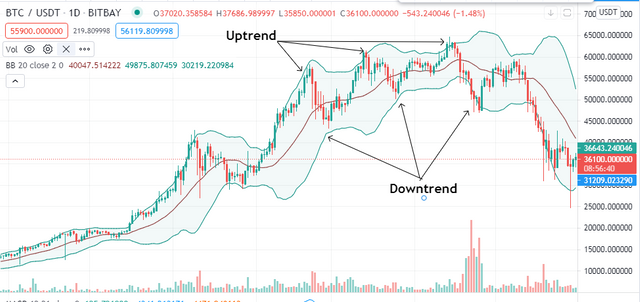
So as everyone wants to make profit, and everyone nows for that buy low and sell high but the problem is how should we know that market is low and it will go high, specially in the trending market, so in that the Bollinger bands can help us in gaining profit.
The uptrend is also call by a overbought market, in which prices go on high prices and it is said to be an overbought market as the buyer have bought a lot and then they became seller and and start selling it to the other buyer with their profits and with this the market comes to the middle line.
And the downtrend market is also call by a Oversold market, as in this the buyer who have bought it already became seller and start selling their asset and the price of the asset decreases and that made a market, an oversold market.
So as we already knew that our period is on 20 days and we have upper and lower line with the difference of 2 Standard deviation with the bottom line, so when the candles are in lower band that means that the market is cheap right now so it is the time to buy.
But before buying there are some point to keep in mind which are to see that are the outer bands are coinciding with the resistance and support level, must see the reversal trend and finally watch carefully in the uptrend in lower band for some time and enter when you think time is good for you.
»————————————————————————————————————✄
4. What is the best indicator to use with Bollinger Bands to make your trade more meaningful?
So see that which Bollinger Bands make our trade more meaningful, I see the MACD and RSI indicators, as I have learned about these two from these lectures.
But I think RSI with Bollinger bands make our trade more meaningfull and it makes things more easier, otherwise the MACD indicator is also an good indicator and I mostly use it in trading but it does not get fit with Bollinger bands according to my observation. So I think RSI indicator is the best indicator to use with Bollinger bands.
Now the question arises that why we even any indicator with Bollinger bands, as Bollinger bands is also a good indicator. But if see closely into Bollinger bands we will get to know that Bollinger bands is a great indicator for identifying areas of value but it does not shows us the ups and downs of the market closely and for the the RSI indicator came which helps in seeing that.
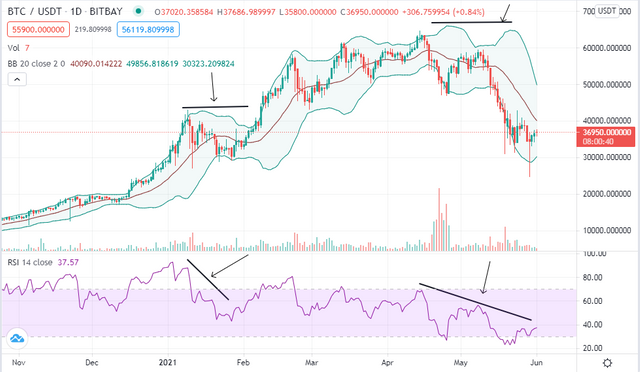
So here we can see that the Bollinger bands is focusing on values as the market makes the higher high but the RSI shows the Lower high.
And in other one when the market makes the lower low and the RSI show the Lower low. So these are the ups and downs the RSI shows and with Bollinger Bands it make our trade more meaningful.
»————————————————————————————————————✄
5. What timeframe does the Bollinger Bands work best on?And why?
To be honest I don't think there are any particular timeframe on which Bollinger bands work best on, as we have seen the charts of different time frame and Bollinger bands works best on every time frame.
It all depends on the trader on which timeframe he wants to use the Bollinger band indicator, so if I were have to use Bollinger bands I will use it on daily and weekly timeframe, as from there I can see the bg picture of the market as if the market is going upward or downward.
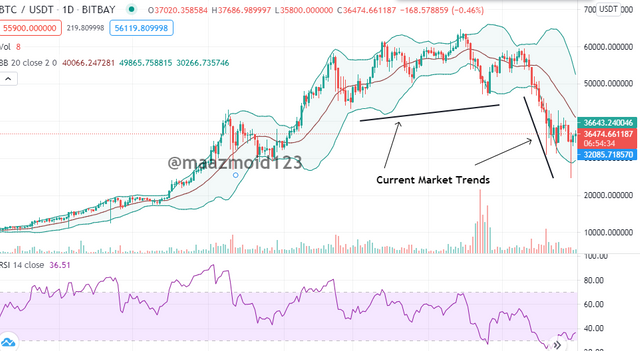
1 Day timeframe
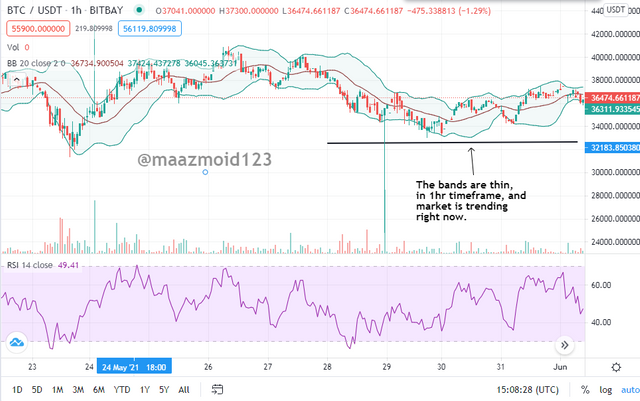
1 Hr Time frame.
So as you can see that in the 1 day timeframe the market is in downtrend but in 1 Hr time frame the market is trending, and it may go down, so that is why I prefer 1 day or weekly timeframe as it shows the big picture of the market.
»————————————————————————————————————✄
6. Review the chart of any pair and present the various signals giving by the indicator Bollinger Bands.
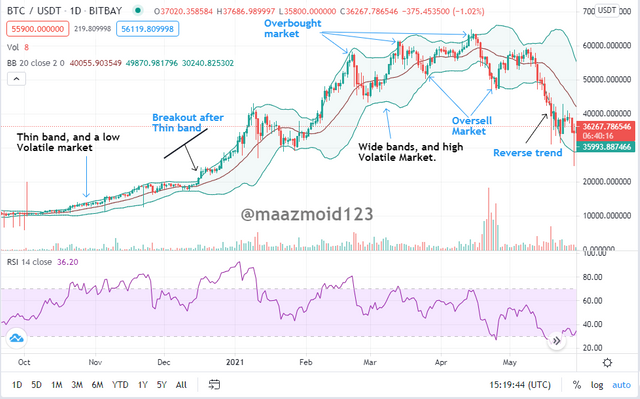
So here I have chosen a pair of BTC/USDT, and have showed the various signals giving by the indicator Bollinger Bands.
Firstly as there was a thin band and has an low volatile market and after the thin band, there is a breakout which causes the market to go into bullish.
After that it is shown that the band are wide and the market is highly volatile, other than there that there are overbought market, which are on resistance level and the market is in uptrend and with that after the overbought market when the buyers start selling to make profit the market goes into the oversell market and the prices of the asset became cheap at that moment and is time to buy.
»————————————————————————————————————✄
Conclusion
So now it is the end, I have learned a lot in this lecture as when the Bollinger Bands got thin, so there are more chances of the market breakout and we can use period 20 moving average to mark our entries in the market and can use the Bollinger Bands with the RSI to get a more perfect results and the probalitly of reversal trades. And also can see from support and resistance level about the market upcoming trends.
So yeah that was it, I hope I covered everything the professor asked for. And if @kouba01 you found is missing or I didn't tell it correctly, so you're the professor you have the right to correct me hehe. Will keep an eye on the next wonderful lecture.
Regards,
@maazmoid123
Hello @maazmoid123,
Thank you for participating in the 8th Week Crypto Course in its second season and for your efforts to complete the suggested tasks, you deserve a 9.5/10 rating, according to the following scale:
My review :
Excellent article in which you handled the topic very well with clear answers to the questions asked which is indicative of the great research work you committed to get this result. Regarding the last assignment in the homework, I would have liked you to have also followed the price action of the chosen pair because it is the most important to use such a technical analysis indicator.
Thanks again for your effort, and we look forward to reading your next work.
Sincerely,@kouba01
Thank you professor, it was really a wonderful lecture and I have learned a lot from that.