Season 2: week 7 - The Swing trading style
Hello Everyone, so today I invite you all to read my today homework which I am going to make on The Swing trading style subject which is given by Professor @yohan2on.
So let us continue with our homework.
The Swing trading style
A Crypto asset pair
So as the professor has told that in Swing Trading people see the technical analysis to do the trading as in this finding the fundamental things are hard. And as everyone knows that in Swing Trading traders want to make a profit in a short time so they set the Monthly, weekly, daily and even some traders also use 4 hours to 1 hour trading times.
So this is all in Short term or even middle-term trading and makes a profit from them. So for this Assignment, I will be using ABA/BNB crypto-asset pair to see match the Swing Trading. And in this, I will be seeing the technical analysis, the Japanese Candlesticks, and moving averages.
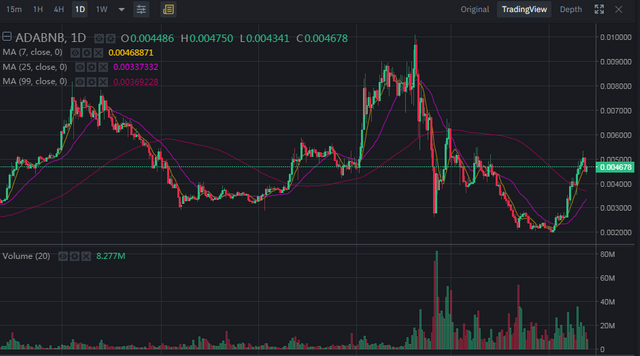
And for this assignment, I will be using Binance.com as I only have an account in that and it also shows the broader version and has good service. And I am seeing the trading view function of that and have and have placed the time of 1 day to see the chart.
»————————————————————————————————————✄
What's your Entry and exit strategy?
So as I saw my chart and in a month and week market it was on uptrend but when I see the 4-hour chart so it was on downtrend.
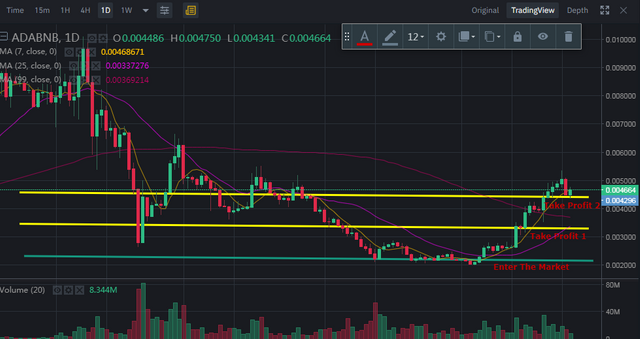
So my strategy will be of a little patience as I will not buy now and I will wait for the price to come down, as in 1-day chart the price is about to come down and then when it will hit the point in which I want to buy then I will buy and then will take my profit as I have shown you all in the chart.
I will be using Systematic Trend following in this, as I am trading based on the trends set by the market and I will wait for the right time to buy and enter the market, they will take my profit and will exit the market.
»————————————————————————————————————✄
Multiple time frame analysis
Every trader has their own mind and they do trading by their own style. As many swing traders use a 4-hour time frame, weekly time frame, and monthly time frame. But a person like me usually uses 15 min time frame or a 1-hour time frame.
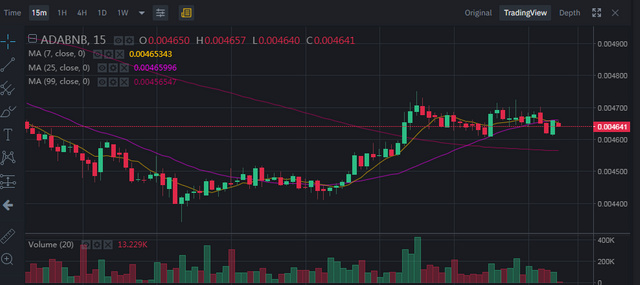
15 Minute Frame:
So in here, every candle is showing the 15 minute time frame. In this, as you can see that it is going in a downward trend. In this I will wait for some time to make the sell as it is in a downtrend now and when it will stop the downtrend then will be a good time, I also will be seeing the indicators.
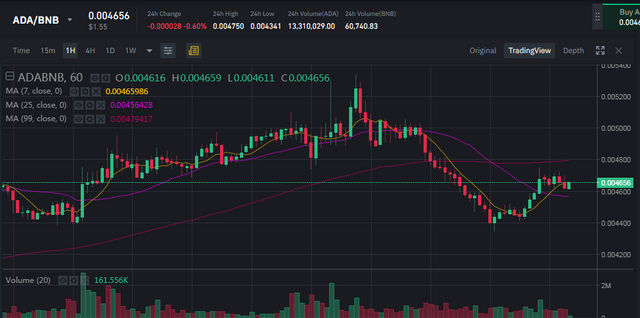
1 Hour Time Frame:
So as in this, every candle is showing the Hour's Time frame. In this, the trend is in an upward trend. And now is also not a good time to enter the market.
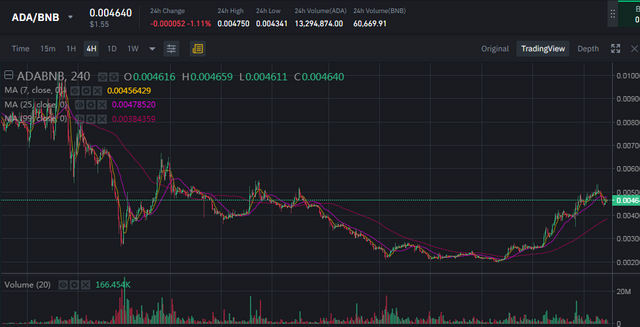
4 Hour Time Frame:
In this, every candle is showing the 4 hour Time frame and in this frame, the candles are in a downward trend now.
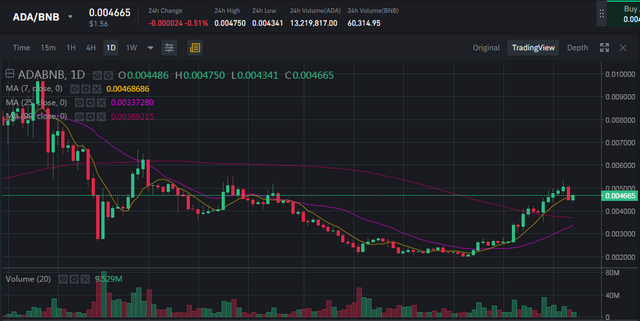
1 Day Time Frame:
In this, every candle is showing the 1 Day Time frame and in this frame, the candles are in an Uptrend now. And I think I am late haha, I should have invested in that some time ago when the downtrend stops. And it was time for the exit with profit.
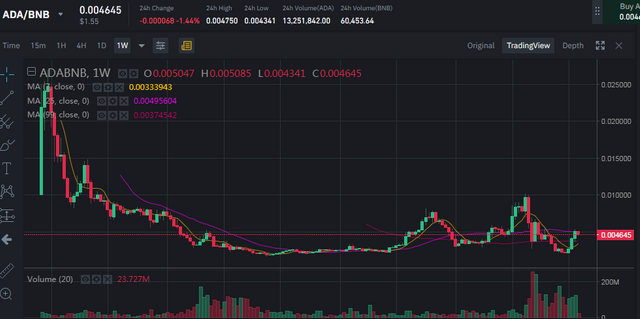
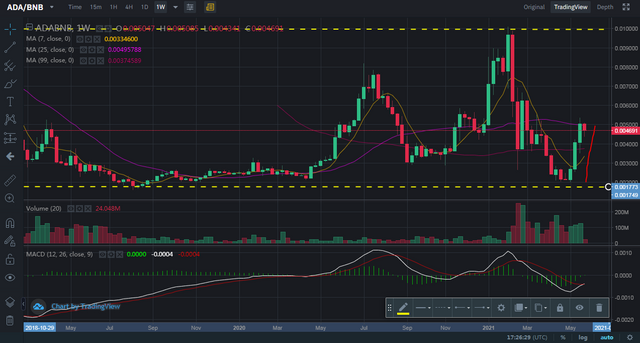
A Week Time Frame:
As is this also every candle shows Week time frame. A week time frame chart is used to see the broader point of how the market is going as it is in a downward trend or an upward trend. And in this I think is the best point to enter the market.
»————————————————————————————————————✄
Candlestick analysis and use of other relevant supporting indicators for your trade decision.
So in here, I put a Week Time Frame candle to the whole view of the chart as to how the market is going and by that, I have seen the lowest and the highest. As the lowest of this had been in July 2019 as it was gone to 0.002000 and the highest it was gone in February 2021 and that was 0.0100000. And the market went into a dip after the last bearish but now the market again is going into an uptrend as it seems so.
So that was the candlestick analysis of the A week chart and I think I have already told you about the other time frames above, so it won't be required I think again.
So about the indicator, I use the MACD indicator to see the indication about the candles as when it goes up and when it goes down. In the MACD indicator, we have to see the Signal line, Zero Line, MACD line, and Histogram.
So we have to see in this that when the MACD Line crosses the Signal line to go high then is the point to buy and when the MACD line crosses the Signal Line but go towards low then it is the time for the sell.
So as when the Histogram goes above the Zero line that means the market is going up and when the Histogram Goes below the Zero line that means that the market is going downtrend.
And the same goes for the MACD line that if the MACD line crosses above zero lines and goes upward that means that market is in an uptrend but if the MACD line crosses the Zero line and goes down that means that the market is in a Downtrend.
Here,
White line - MACD Line
Red Line - Signal Line
Green candles - Histogram
And the Zero line is the one on which the Histogram is going upward and downward
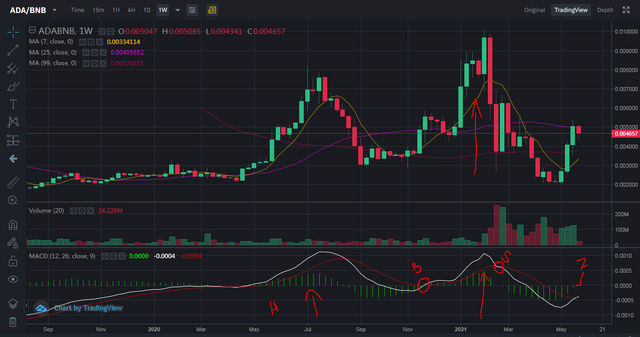
B - Buying Point
S - Selling Point
H - Histogram
Z -Zero Line
»————————————————————————————————————✄
Trade management ( Setting stop loss, trailing stop and take profit)
So everyone knows that sometimes the market goes in your favor and sometimes it does not go in your favor. So for that, we have to make a stop loss and trailing stop and must know that when to make a profit. So here my trade management will be:
My stop loss = $0.003000
Take profit = $0.0080000
Trailing stop loss = $0.004000
»————————————————————————————————————✄
Conclusion
So yeah that was it, I hope I covered everything the professor asked for. And if @yohan2on you found is missing or I didn't tell it correctly, so you're the professor you have the right to correct me hehe. Will keep an eye on the next wonderful lecture.
Regards,
@maazmoid123
Tweet promotion
Hello @maazmoid123,
Thank you for participating in the 7th Week Crypto Course in its second season and for your efforts to complete the suggested tasks, you deserve a 6/10 rating, according to the following scale:
My review :
The lesson was given by the professor @yohan2on.
An article with acceptable content that dealt with swing trading strategy from different sides. The work lacks a methodology in answering such as justifying your choice of the MACD indicator without using it in trading for a multiple time frame without analyzing the price movement of the pair for each period.
Thanks again for your effort, and we look forward to reading your next work.
Sincerely,@kouba01
Okay, professor, I will keep that next time.