Steemit Crypto Academy Contest / S15W6 - Chartist analysis.
Assalamualaikum dear brothers and sisters |
|---|
Hope you all are doing well and good and enjoying the best days of your life. im @danish578 from Pakistan and you are reading my bloq On steemit platform.You all are welcome here with my deep of heart.
Introduction to the topic
by @crypto-academy
Chartist analysis, a method implemented in financial markets to forecast future price movements through analysis of past price data, trading volume and other historical market information is the name of technical analysis. The main methodology is based on graphs and financial indicators for detecting price trends and patterns. The essence of chart patterns is in their ability to give traders and investors the clues about the mood of the market, which shows the possible future price moves.Some key aspects include:
To sum up, technical analysis also using chart patterns in contradiction with the traders and investors by using historical price data and market psychology. It is necessary to point out that charts are powerful tools but one should not rely on them exclusively because they are not foolproof and one must utilize other methods as well as risk management techniques.
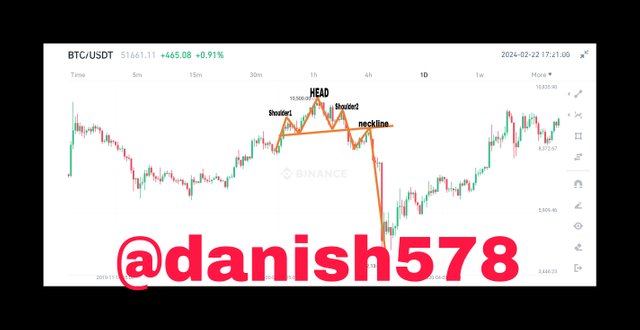
The pattern which is known as head and shoulders pattern is a bearish reversal pattern that is noticed in the financial markets. It consists of three peaks: small (shoulders) (Two shoulders right and left)and one big (head). The downward sloping trendline indicates that a trend reversal might take place when the price goes below the support line (neckline), which happens to be the horizontal line that connects the lower support levels of the shoulders. This gearing is usually employed by the traders to anticipate the fall in the prices in a downward direction.
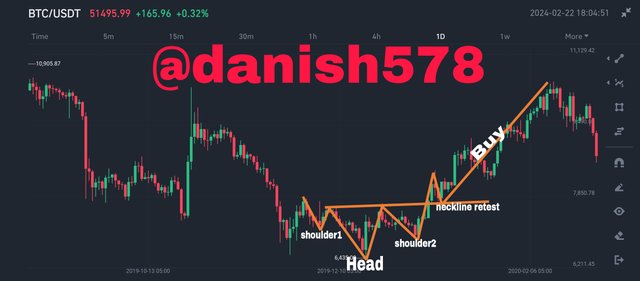
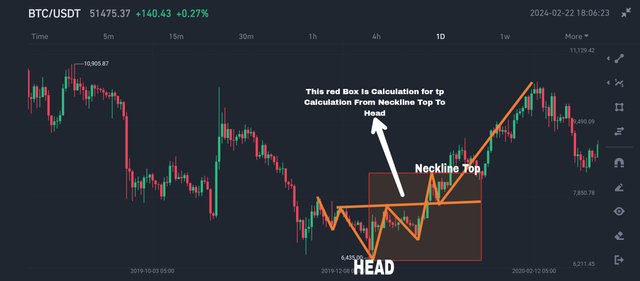
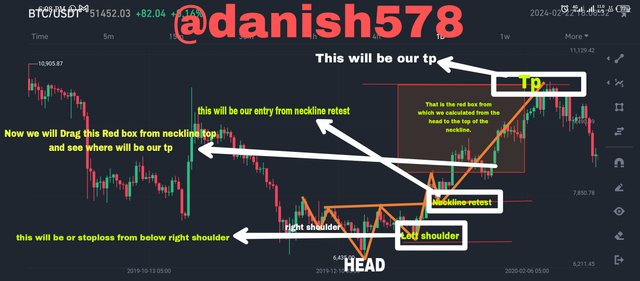
The inverse head and shoulders pattern forms during a downtrend with three troughs: a left shoulder, his lower head, and a right shoulder. The neckline, which curls up at the sides, unites the shoulder peaks. A breakout above the pendant of the pattern suggests that the pattern is confirmed, indicating that the pattern is an indication of a possible bullish reversal. Traders compute the distance from the head to the neckline to achieve price targets in event of breakout. It is a bearish turnabout pattern that means a change of minds towards the market. Step1In the first step, what you are seeing is a simple head and shoulder pattern drawn on the bullish side. step2In step 2, we will calculate the distance from the neckline top to the head for the calculation of the take profit (TP). Then, we will draw a red box that we will later place on the top of the neckline. This will help us know where to position our TP. step 3In step 3, I have mentioned everything on the chart. Our entry level is at the neckline's retest level, our stop loss is below the left shoulder, and our take profit (TP) is at the top of the red box. We have placed the red box at the top of the neckline, which we used for calculation from the neckline to the head. Now, we have positioned that red box at the top of the neckline, and the top of that box will be our TP.
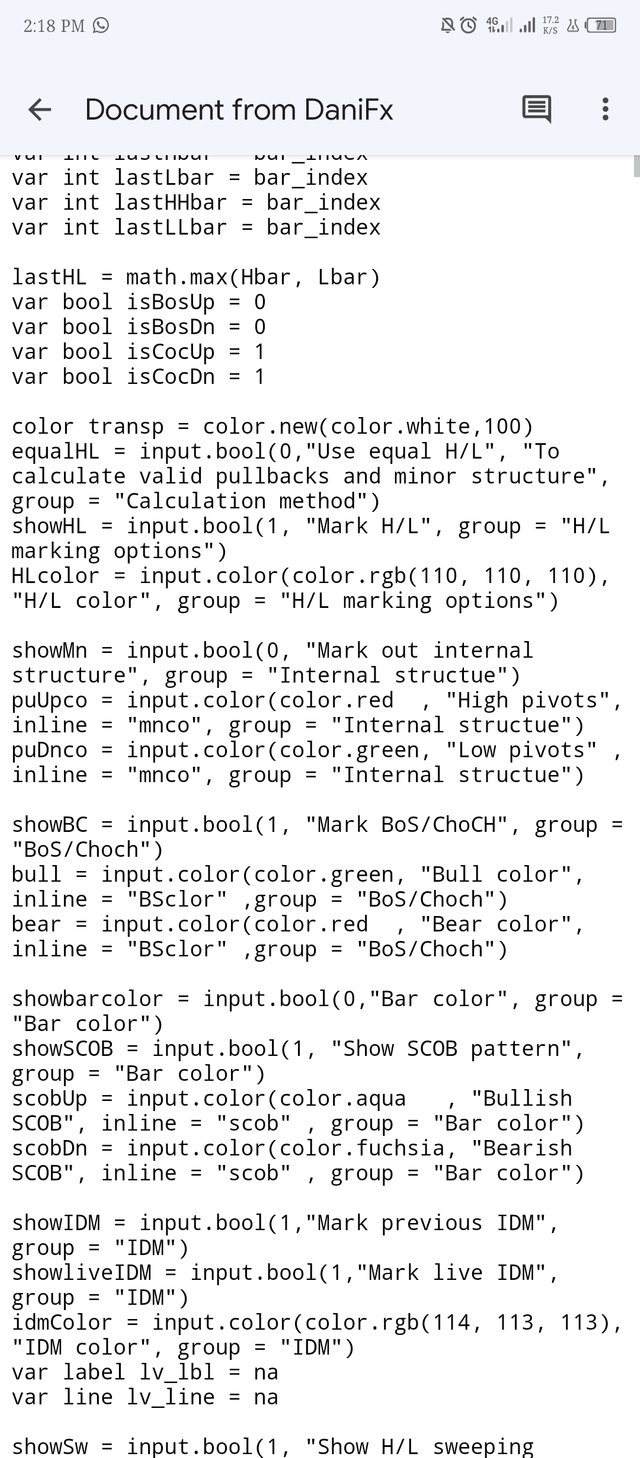
When it comes to trading the STEEMUSDT pair, I don't use chart patterns at all. I've been trading since 2019, and initially, I used to trade based on chart patterns or trendlines. However, now I trade based on the Smart Money Concept and the concept of liquidity. I've developed my own indicator called DANIFX SMC Which is nOt published But i have Script Known as Pinescript, which helps me map the Smart Money structure. I analyze the STEEMUSDT pair based on the Smart Money Concept and liquidity. In the contest, you asked about Question Patterns, so I felt compelled to apply patterns on the chart and write about them. @suboohi @princesslayla @memamun @malikusman1 @steemdoctor1 @robin42 @entity01 @mranton07 @i-am-ejaaz @zainblouch @awaisash001 @allahnawaz03 @mohammadfaisal @richy20 for participate in this contest. Thank you for visiting my post |
|---|



Twitter Share: https://x.com/danifx578/status/1760665455151534196?s=20
Upvoted. Thank You for sending some of your rewards to @null. It will make Steem stronger.
Thanks alot for curation on my post Happy to see your support thanks again
Greetings friend,
Yes, Chartist analysis is a method used in financial markets to predict future price movements. It involves analyzing past price data, trading volume, and other historical market information. By looking at graphs and financial indicators, traders can spot price trends and patterns.
Chart patterns are important because they give traders clues about the market's mood and potential future price moves. They help identify trends (bullish, bearish, or consolidation), determine entry and exit points for trades, manage risks, and confirm other indicators.
In a nutshell, chart patterns are a valuable tool in technical analysis for understanding market movements and making informed trading decisions. It's like having a secret code to decipher the market's behavior. You've submitted a very wonderful entry and I say congratulations in advance.
Thanks for your thoughtful insights! Indeed, chartist analysis plays an important role in understanding market dynamics and making informed decisions. Chart patterns serve as valuable indicators, guiding traders through market trends and potential risks. Your encouragement means a lot. I am grateful for your kind words and support.
Hello friend how are you and you have use the appropriate chart and very good definition and your hard work is showing in your post.
The use of chart is really important for all the traders and I think they must get guidance for the chart
Hello @danish578! Your participation in the Steemit Crypto Academy Contest on Chartist Analysis is impressive. Your explanation of chartist analysis is thorough highlighting its significance in identifying trends entry/exit points risk management and market sentiment. The inclusion of visual aids such as the head and shoulders pattern in the BTC/USDT pair adds clarity to your presentation. The inverse head and shoulders pattern is also well explained with informative screenshots. Your insights into the technical analysis of Steem emphasizing the use of Smart Money Concept showcase your trading experience. Great job and best of luck in the contest!
Thank you for your enthusiasm and opinion! Participating in the Steemit Crypto Academy competition was an unforgettable experience for me. Your support is extremely important to me. I'm glad you found my analysis inspiring. I will strive towards even greater excellence in the coming competitions. Thanks again
You have defined chartist patterns and have explained it's usefulness in trading. Some of these importance are identifying entry and exit point, identifying trends, etc.
Ir is also good to know that you have developed your own indicator. This is amazing. Maybe, you share that with me now, let me see how it works.
Wishing you the best in this contest.
Thank you for your consideration I'm glad you found my explanation of chartist patterns and their use helpful in trading.Thank you for your interest. Your good wishes are very important to me. Thank you
Hello pal you really did well in your analysis and I love how you chatted analyzed your assets so cleanly and neatly that anyone who wishes to go through your post would actually be attracted deeply because of the orderliness have co-ordination on your article.
Please also engage on my entry too thanks, https://steemit.com/hive-108451/@starrchris/steemit-crypto-academy-contest-s15w6-chartist-analysis
Thank you so much for your kind words! I really appreciate your positive feedback on my analysis. It means a lot to me that you found the presentation clean and orderly. Thanks again