Steemit Crypto Academy Contest / S15W6 - Chartist analysis.
What is chartist analysis? And the importance of chart patterns.
What is chartist analysis? And the importance of chart patterns.
What is the shoulder head shoulder pattern? Show screenshots using the BTC/USDT pair. You can use another cryptocurrency pair if you wish.
Explain the formation of the inverse head shoulders pattern. Show screenshots of a cryptocurrency pair that displays this pattern.
For the technical analysis of the Steem, would you use chart patterns? Explain your answer

Before I begin I want to say I really appreciate the team for producing such effective interesting and very educative contest for all to participate and learn more about crypto trading and is various trading techniques. I would say please keep it up.
.png)
As the name implies the chartist analysis is the technique of using chart patterns to read and predict the future price movement of an asset with the help of pre-existing price movement represented as candle sticks. This gives a solid structure as long as crypto trading in involved, so therefore it's benefits can not be ignored or resisted.
Chartist analysis, which can also be called as technical analysis, is a method used to monitor , calculate and predict the future price movements of an assets mostly crypto related asset, this is done by analyzing historical price charts and trading volumes of an asset.
This approach is based on the belief that historical price movements and patterns tend to repeat themselves, providing valuable insights into potential future market trends for example one reason so many are hopping and trusting Bitcoin halving is because of the historical data experienced at every previous bitcoin halving event.
The importance of this chart patterns in chartist analysis act efficiently and efficiently to help traders and investors find financial advisable decisions before thinking of buying or selling their different crypto assets. Each of it's patterns has informative visual representations of historical price movements that tells every interested personal on the strength or weakness of a trend in the, potential trend reversals on some crypto analysis, and various market sentiment.
One of the most important uses of this chart patterns is to help find or discover trends in the market. Whenever I say Trends I mean they are the general direction in which an asset's price is moving at a particular period in time. Technical analysing chart patterns, like
the support and resistance line,and moving averages, assist market analyst predicting whether an asset is either experiencing an uptrend, downtrend, or a sideways trend in period of time.
That's to say that identification of market trends is very essential for every trader because it produce efficient and trustworthy data that could predict price movement.
Chartist analysis covers a wider range of area that shows credible potential future price movements of an asset to generate profit. Some of these common patterns include head and shoulders, double tops and bottoms, triangles, and flags pattern.
Crypto Traders with effective knowledge uses these strategic patterns to find and discover potential trend reversals or continuation of existing trends for an asset. The Pattern recognition in the market helps traders predict the possible price movements and place profitable trades.
📈Chartist analysis is very efficient in revealing
very important support and resistance lines. Support lines are price lines where an asset is expected to stop falling and may even bounce back, while the resistance line are lines where it tends to stop rising, as the name implies the support line produces support for the asset while the resistance line produces resistance to the cover of an asset.
Identifying these levels is crucial for traders as they can use them to set entry and exit points, and whenever a price beat this line there is a very volatile movement in the market.
📈Chartist analysis helps display the collective psychology of market investor. For example Patterns like flags and pennants helps show the periods of consolidation, indicating uncertainty in the market over a period of time. So therefore understanding the awesome technique behind these patterns allows traders to make profitable trades from the market sentiment and make predictions about potential future price movements which could be helpful to others.

📈Most successful trading involves effective risk management, and chartist analysis is very essential in the search of achieving it. With the
help of support and resistance lines, investors can find powerful stop-loss point to help limit chances of running on losses. Also, by recognizing the chart patterns that shows trend exhaustion or reversal, traders could easily texit positions before massive losses occur.
📈Chartist analysis permits traders to efficiently analyze price movements of an asset on different timeframes. Short-term traders may focus on hours, seconds or minutes charts, while long-term investors may use weekly and monthly charts timeframe to analyze the market before placing a trade. Monitoring multiple timeframes helps in improving an effective analysis of the crypto market.
📈Chartist analysis are also used together with other technical analysing indicators to detect and read validate trading signals. For example, using the KDJ, a moving average together with a well a nicely analysed chart pattern would produce a very powerful signal on the upcoming trend, the upcoming reversal and the volatility of the market.
The Head and Shoulders technique is a very old but powerful and widely recognized chart analysis skill in technical analysis world. This analysis pattern usually detect reverse signals, thats to say it shows when the current trend want to end a reversal and the opposite trend is coming up (mostly a downtrend or sell signal). The physical formation looks like the outline of a head and shoulder of a person, this technique has Four main parts: a left shoulder, a head, and a right shoulder.
🔥Left Shoulder:
This is usually the first part of our technique, the shoulder head shoulder pattern begins with an initial upward price movement, it's called left shoulder because it is the shoulder located at the left hand side because it's always shorter than the head. During this stage, the price of the asset rises to a certain level, which turns out to be a temporary high for the current uptrend. It very important to find the left shoulder , although it might not be perfect because it might use a fake out to cross the neckline resistance. So therefore after the upward movement, there is an expected downtrend that stops or touches the neckline .
🔥 Head:
Immediately after the left shoulder, there is a stronger uptrend in price, forming the head of the pattern. This upward trend goes above the peak of the left shoulder, causing a higher high before producing another Downtrend.that stopes also at the neckline support line. The head shows there was a period of increased buying interest and upward momentum in movement of price. This retracement is most times deeper than the previous downtrend after the left shoulder.
🔥Right Shoulder:
The technique concludes with the development of the right shoulder. The right shoulder is Similar to the left shoulder because the upward trend this time doesn't reach that of the head but it's downtrend is expected to break the resistance line generating a new reversal signal. the price of the assets experiences a fragile upward movement, but as I have said falls short of the height reached by the head. The right shoulder which is located at the right generates Lower lows and a trend reversal.
🔥Neckline:
The neckline is a horizontal support line that connects the lows of the left shoulder, head, and right shoulder. It acts as a support level and plays a very important role in confirming the pattern. The neckline is a key aspect in this
because it link or joiner of the head and it's shoulder, it act as the actual neckline works.
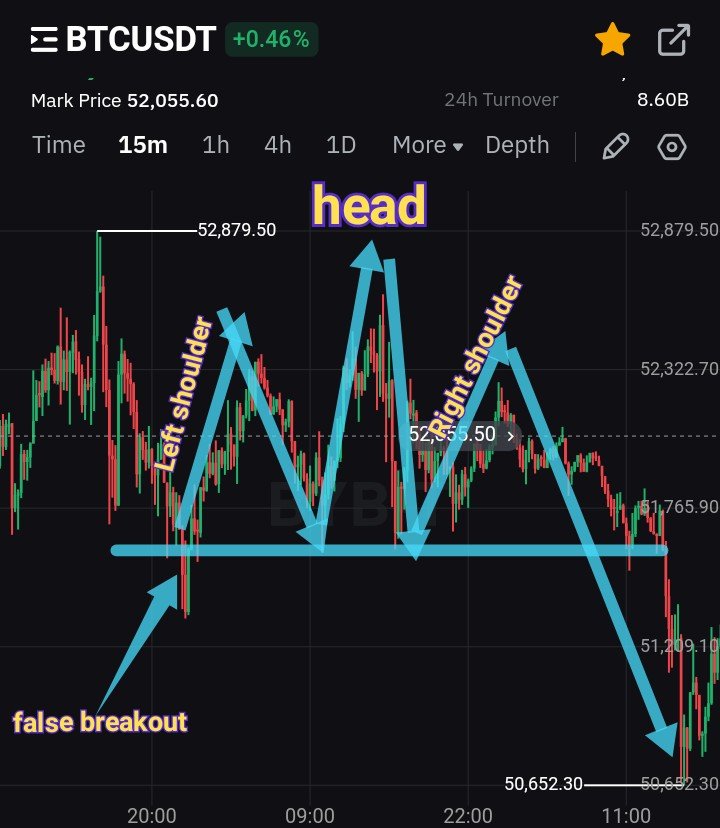
On a 15 minutes timescale chart Bitcoin asset produced a head to shoulder signal, that would produce a downward movement or downtrend in the crypto market, the neckline of $51.600 that acted as a support line was broken or crossed and hopefully as you can see it started downtrend that ended at around $50,600. So therefore a trader like me would place a sell order in the crypto future market and you would see me print profit because of this awesome trading techniques

Above is a trading chart of INJ/USDT, from the above chart you would see how effective the support line also known as the neckline held the seller until the final broke downward 33.900 from the Neckline of around 36.6747. this was an awesome sell signal that could generate awesome and quality profit in a short period of time, all you need to do is to be careful.
As the name implies the Inverse Head and Shoulders technique is the direct opposite of the head and shoulder technique, it's also very old but powerful and widely recognized chart analysis skill because it was invented same time as the head and shoulder technique.
This Inverse Head and shoulders analysis pattern also detect reverse signals, thats to say it shows when the current trend want to end a reversal and the opposite trend is coming up ( for a reversal from an downtrend to a uptrend). The physical formation also looks like the outline of a head of a human, just like head and shoulder technique, it also have has four main parts: a left shoulder, a head, a right shoulder and a neckline.

🔥Left Shoulder:
This is as usual the first part of our technique, the shoulder head pattern begins with an initial downward price movement, it's called left shoulder because the crypto market move from left to right and as the first signal it would always be located at the left. During this period, the price of the crypto asset drops to a certain level before going upward to hit the neckline also acts as resistance line, it gives a downward movement which turns out to be a temporary low for the current downtrend. This left shoulder is really very important to find the because it a starting point to the head and shoulder, just please note it might not be perfect because it might produce a fake out to cross the neckline resistance line. In summary after the downtrend movement, there is an expected upward that stops or touches the neckline.
🔥 Head:
Just after the left shoulder, there is a stronger downward movement of price, this forms the head of the head and shoulder technique. This downward trend goes below the depth of the left shoulder, causing a lower lows before producing another longer upward movement that stops also at the neckline resistance line. The head shows there was a period of increased seller interest and downward pressure in movement of asset price.
🔥Right Shoulder:
This is the last technique that produces the reversal as the development of the this shoulder. The right shoulder is Similar to the left shoulder because the downward trend but this time it doesn't reach the head, this uptrend is expected to break the resistance line generating a new reversal signal going upward. the price of the assets initially experiences a fragile downward movement, but as I have said
🔥Neckline:
Just as I have said this neckline is a horizontal support line that connects the lows of the left shoulder, head, and right shoulder. It acts as a resistance line that produces new high highs and it plays a very vital role in confirming the head and shoulder technique. The neckline is a important aspect in this because it link or joiner of the head and it's shoulder, it act as the actual neckline works and It helps generate a stop loss signal as a medium imploy risk management.

Analysing the XRP/USDT in a four (4) hour timescale chart, you can see this signal gave me an accurate buy signal, just imagine entering the. Trade when the signal was first seen, that's to say entering around $0.5367 and selling XRP at around $0.5797. the trader would make massive profit in a short period of time
Yes, definitely the head and shoulder technique can be used to analyze the steem coin because the head and shoulder can be used to analyze any sort of asset that can be represented on the chart. Whether the asset is very expensive like Bitcoin or cheap as a Dodge coin, it can also be used to analyze Both fiat currency market or crypto currency market.
In other words it's can be called a universal technical analysing tools, because it would produce such quality output or results as it is expected to do always, below i am going to use it to analyze STEEM/USDT using Tradingview analysis tools. It can be used to help detect the reversal signal on steem asset, that is to say it can help to detect an upcoming bullish signals and an upcoming bearish signal after a reversal. If properly used it could help generate profitable trading signals from trading either future trading or spot trading.
Although the head and shoulder technique could be used universally on all asset, the should be special observation for asset asset where the liquidity is expected to be lower than that of bigger assets like Bitcoin and ethereum, this is because the are smaller amounts of buy and seller in this marker than that of bigger assets like Bitcoin and Ethereum. So therefore the downtrend movement or the uptrend movement might not be so long or high as it would be in bigger assets like Bitcoin and Ethereum.
Finally make sure you look for a confirmation signal before entering the trade as a medium to imploy risk management technique, this would help reduce your chances of losing your assets. For Example in the below trade I won't enter my trade at $0.2160 instead I would enter below at around $0.2149 per steem.

As we can see above is a STEEM/USDT price chart where the head and shoulder technique was used to find the change in price movement in other to generate mouth watering profits. Using the head and shoulder technique I noticed I change from $0.2160 ( just below my neckline) to it dropped to $0.2064 per STEEM. Placing a sell order at that point could trigger massive profit from the trade.
In conclusion I would say that this Chartist Trading Techniques is a very awesome one and it could generate any trader massive profit as you can see above among all Chartist trading technique I will say I prefer the Head And Shoulder Technique and the Inverse Head And Shoulder Technique more because so far it has proven to be effective and efficient in producing trading signal.
Note: images reference are all from https://www.bybit.com.
I want to use this medium to invite @sahmie @basil20, @johnmitchel @jbeecom @dave-hanny, @woka-happiness and @vickyson
Remember starrchris cares ❤️😍
Greetings my boss,
Definitely the Chartist Trading Techniques are super cool and can help traders make some serious cash. Among all the techniques, the Head and Shoulder Technique and the Inverse Head and Shoulder Technique are the ones I dig the most. They've shown to be really effective in giving out trading signals. And I must say you did exceptionally well explaining all the intricacies of the theme at hand, all the best my ogah kpatakpata at the top.
Yea you spoke like a professional and I appreciate that 😉
Professional keh, I'm still very much a learner my friend.
No they wine me oo boss
U way the win like na u be originator 😂😂
😊 Thanks for inviting me and good luck to you.
Thanks pleasure is mine, keep the good work on.
You have very nicely shown Head and Shoulders analysis in both modes. Through these two analysis we can get information from ground and up train down train giving us indication about the market trend.Good luck to you God bless you.
Thanks for sharing your opinions I really appreciate your work 😊 thank you very much for going through.
Thank you, friend!


I'm @steem.history, who is steem witness.
Thank you for witnessvoting for me.
please click it!
(Go to https://steemit.com/~witnesses and type fbslo at the bottom of the page)
The weight is reduced because of the lack of Voting Power. If you vote for me as a witness, you can get my little vote.
Thanks friend for such awesome comments
You have explained the importance of chartist analysis and chart patterns in detail. From your post we got information about various analysis techniques which are very important for crypto trading. Thanks for your support and advice. Good luck .
I really appreciate your good job thanks for commenting I appreciate
Your most welcome dear brother 💖 im glad you appreciate it
Saludos cordiales gran amigo starrchris, un placer saludarte y leer tu participación.
Posees una buen conocimiento de los patrones y el análisis chartista, se puede notar en la facilidad con que abordaste cada interrogante.
Te deseo muchas bendiciones y que tengas una feliz tarde. Éxitos.
Thanks you very much for accepting my request 😊😊
Upvoted! Thank you for supporting witness @jswit.
Thanks for sharing this great support
Hey there! Your in-depth breakdown of chartist analysis is truly insightful. The way you've explained head and shoulders and its inverse using real time examples is incredibly helpful. Its evident you have a solid grasp of technical analysis and your practical approach makes it easier to follow. Best of luck in the Crypto Academy contest
Hey bro I appreciate such quality content friend
You have clearly explained what chartist pattern is.and how it helps traders to make informed trading decisions.
You have also used various charts to explain what head and shoulder and the inverted form of it.
You have also stated clearly the importance of chartist patterns and how they can be read or discovered on the asset chart.
I Wish you the best in this contest.
Mama your comment means a lot