Crypto Academy Season 3 | Intermediate Course: Vortex Indicator Strategy
Vortex Indicator? What the heck is that? You may wonder. There's a good chance this is the first you've heard of the term. Well, that's understandable because the indicator is approximately ten years old – or should I say 'young.'
In 2010, Etienne Botes and Douglas Slepman developed an indicator based on the works of J. Welles Wilder (better known as the father of RSI). On this occasion, however, a different invention by Wilder comes to mind.
Etienne and Douglas built the Vortex Indicator (VI) using the True Range developed by Welles Wilder. They presented these findings in a Technical Analysis of Stocks and Commodities magazine.
Though the indicator was initially used to analyse stocks, over the years, it has gained some recognition in the crypto sphere. So what is it about?
Well, continue reading to find out. In this article, we will examine the following:
- What is Vortex Indicator (VI)?
- How Vortex Indicator Works
- VI Configuration
- Buy Signals of Vortex Indicator
- Sell Signals of Vortex Indicator
- Divergence of +VI trendline and price chart
So, let's begin by answering the first question.
What is the Vortex Indicator (VI)?
Like the CCI, the Vortex Indicator can be used to spot or determine changes the direction of trends (market reversals). It can also be used to confirm the current market trend.
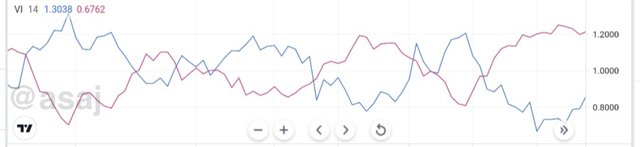
Fig. 1: The crossing of VI trendlines | tradingview.com
The Vortex indicator is made up of two lines that intercept at certain points in time as seen in fig. 1. The movement and interception of these lines aid traders to forecast future change in price movements.
For the sake of this study, let's call the blue line the bull market and the red line bear market. The blue line indicates positive movement in price (+VI). When the blue line rallies above the red line it means bull market is winning.
On the other hand, the red line signifies a negative movement in price (-VI). When the red line rallies above the blue line it means bear market has the upper hand. This also indicates that the market has succumbed to selling pressure.
How Vortex Indicator Works
The vortex indicator is derived by calculating the distance between the highs and lows within a certain time frame.
The length between the current period high and the last period low is a positive movement in price, hence, results in an upward movement of the blue line (+VI).
However, if the current period low comes after a last period high, this marks a negative movement in trend. Conquesently, the red line (-VI) will rally upward.
The wider the distance between lows and highs, the stronger the trend, and the wider the distance between the red and blue line. The vortex indicator can be configured to suit one's preference. We will take a look at this in a moment.
So, the movement of the negative and postive changes in price brings about the formation of two lines moving in oscillating motion.
The crossing of these lines serves as a buy or sell signal to most traders. More on this later but as always, it is advisable to use other indicators to filter false signals and for confirmation of signals.
How the Vortex Indicator Is Calculated
Well, let me explain this without getting too technical. In simple terms, the vortex indicator is constructed through the following steps.
Establish the trend: The VI seeks to establish the current trend of the market by measuring the distance between the highs and lows of past and curent periods. If a high comes after a low that is a positive price movement (in other words an uptrend) or vice versa.
Choose a time period (parameter length) J. Welles Wilder's works suggest that 14 periods (that is 14 minutes, 14 hours, 14 days, 14 months, and so on) often give more accurate readings than any other time period. So the readings of the past period lows and highs are calculated within a 14 period-window. However, some traders prefer a wider time period (for example 28 period).
Calculate the true range (TR): Welles Wilder’s True Range is calculated by subtracting the current low from the current high, then subtract the previous close from current high as well as current low.
In a ranging market, the vortex indicator, like most indicators, often give misleading signals. In a situation like this, it is advisable to increase the length of periods used in the indicator. This can even out price volatility. For instance, you can increase the length from 14 to 28 periods.
VI Configuration
Now, let's discuss how to add the vortex indicator to a crypto chart. We will also discuss how to set up its configuration. Tradingview.com will be used in the following guide.
How to add the vortex indicator to a crypto chart
Here is how to add the vortex indicator to a crypto chart:
Go to tradingview.com
Launch a chart on the website
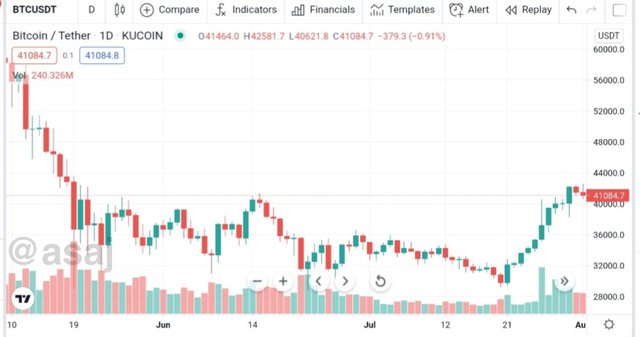
Fig. 2: BTCUSDT pair | tradingview.com
- Click on [indicators] on the top menu
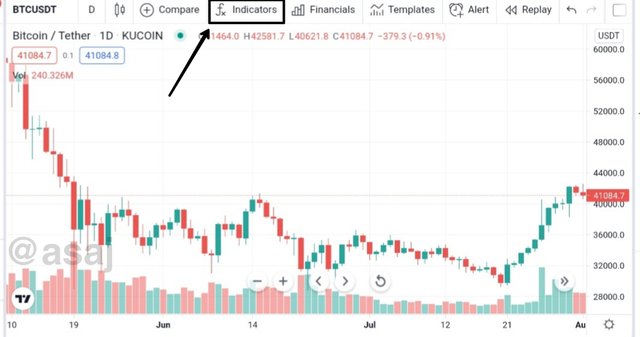
Fig. 3: BTCUSDT pair | tradingview.com
Upon clicking on the indicators menu, there would be a pop-up notification on your screen.
- Type
vortexin the search box provided and select [Vortex Indicator] in the Built-ins library
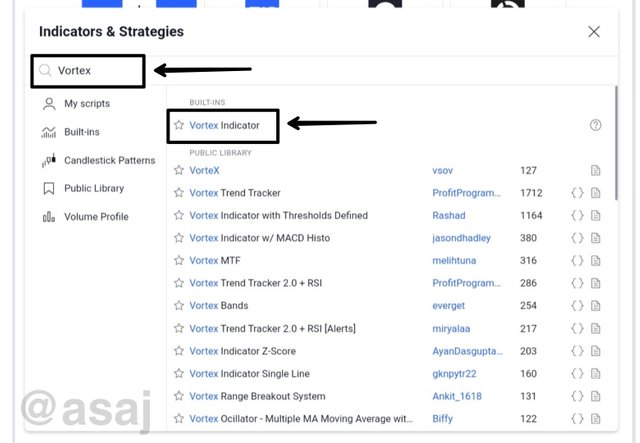
Fig. 4: Pop-up notification of indicators | tradingview.com
Tada! You have successfully added the vortex indicator to the crypto chart as seen below.
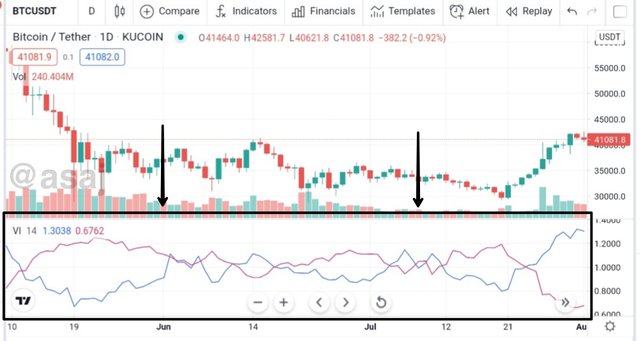
Fig. 5: Vortex Indicator added to BTCUSDT pair | tradingview.com
Now, let us examine the configuration of the vortex indicator.
How to configure the vortex indicator
Below is a guide on how to configure the vortex indicator on a crypto chart:
- Tap the VI written on the chart to bring more options
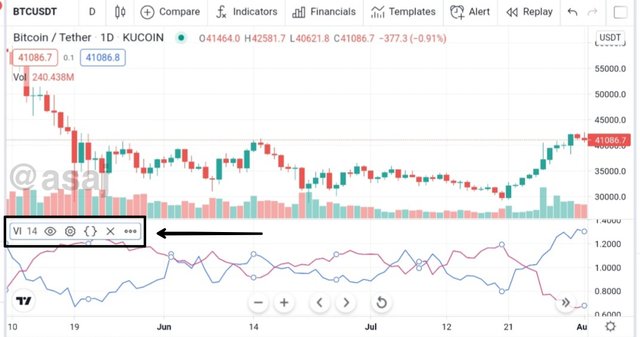
Fig. 6: VI options on BTCUSDT pair | tradingview.com
- Then click on the settings icon
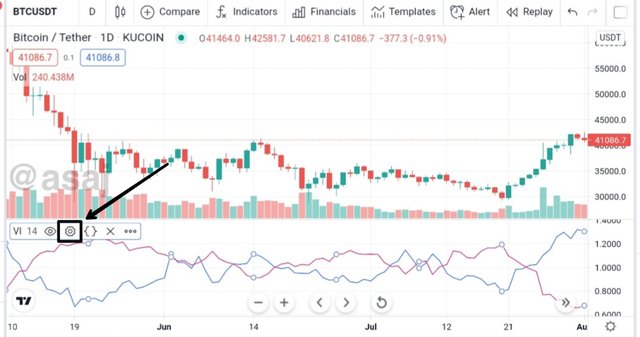
Fig. 7: VI settings icon on BTCUSDT pair | tradingview.com
Upon clicking the settings icon, a pop-up will appear on your screen.
- In the Style settings, ensure the positive VI is set to blue, negative set to red, and precision is set to default
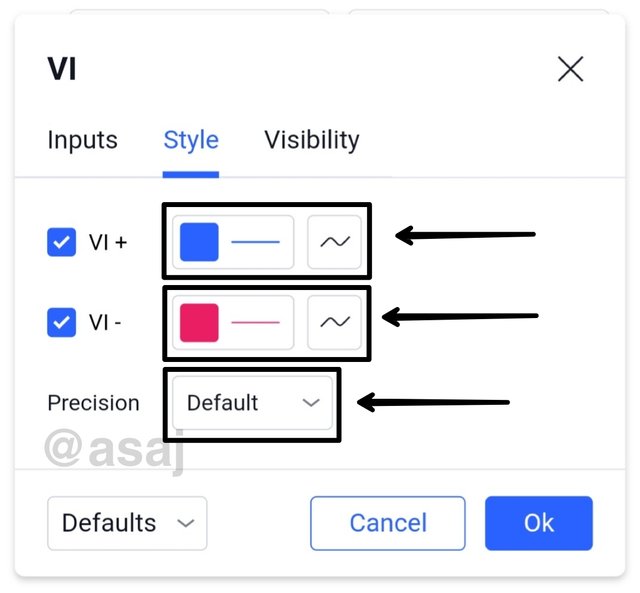
Fig. 8: Style settings of vortex indicator | tradingview.com
- In the Inputs settings, make sure the indicator timeframe is set at 'same as chart,' choose a parameter length (14 is the default length)
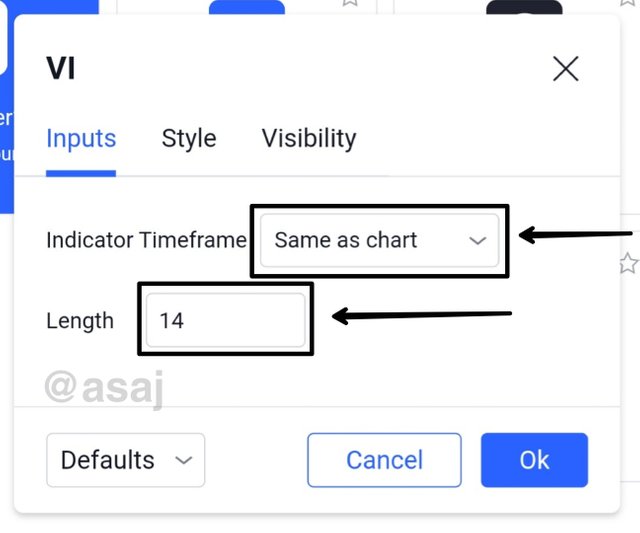
Fig. 9: Inputs settings of vortex indicator | tradingview.com
- Set the visibility to default
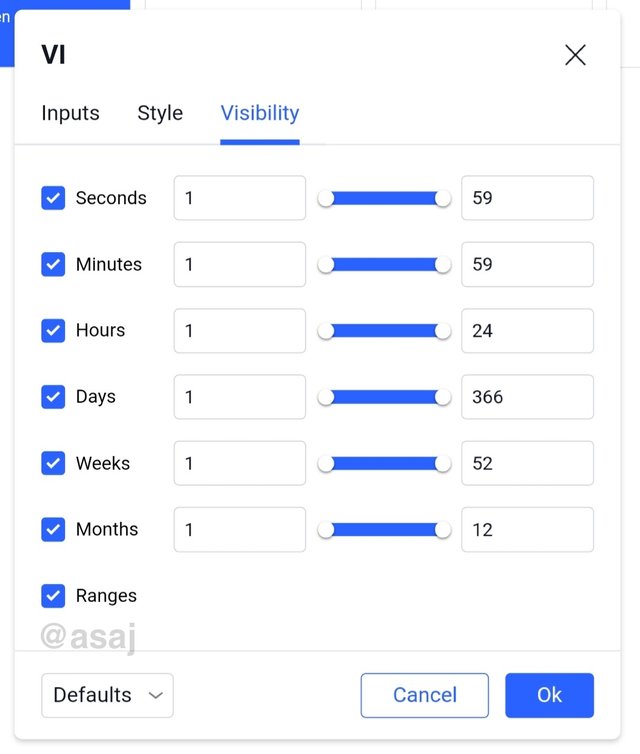
Fig. 10: Visibility settings of vortex indicator | tradingview.com
Enough about VI configuration, let's talk about its signals.
Vortex Indicator Strategy
In this section, we will discuss my vortex strategy.
Buy Signals
For most traders, when the blue VI line (positive VI or bull market trendline as I like to call it) rallies across the red line (negative VI or bear market trendline), it is a buy signal.
Personally, my trading technique using the vortex indicator varies depending on the current market situation. For a ranging market, I prefer to use a length parameter of 30 periods. I choose 30 periods for a ranging market because it reduces the margin of error due to volatility in price.
However, I normally set the length parameter at 7 periods. Setting the length at 7 periods gives the fastest signals in a normal market condition.
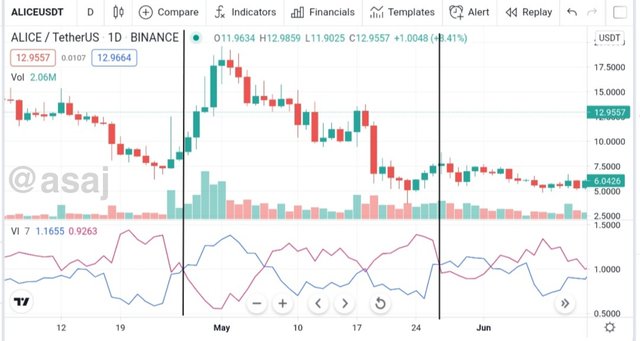
Fig. 11: Buy signals of VI trendlines on ALICEUSDT pair chart | tradingview.com
In Fig. 11, we can identify two vivid buy signals of the vortex indicator. A black line has been drawn across the two buy signals.
Notice the difference between the two buy signals. The first one is a strong buy signal because the positive and negative VI trendlines goes in opposite directions after the interception.
The second buy signal isn't as strong because the blue line and red line moves in the same direction after the crossover. When both lines form a parallel movement after crossover, it often means that the pressure of bull market isn't strong enough.
Sell Signals
When the positive VI trendline (blue line) falls and crosses the negative VI trendline (red line), that is a sell signal. You can confirm this signal using the Moving Average Convergence Divergence indicator (MACD).
As mentioned earlier, it is best to increase the length or periods to 28 or 30 in a ranging market. Then reduce the periods to 7 in a normal market condition.
It is important to note that choosing 14 periods isn't compulsory. Traders can use any length parameter that gives them the best readings, provided it is used together with other indicators.
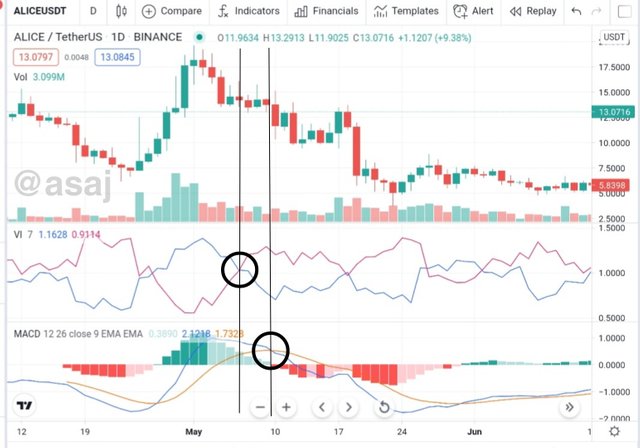
Fig. 12: Sell signals of VI trendlines and MACD confirmation on ALICEUSDT pair chart | tradingview.com
Setting my vortex indicator to 7 periods has paid off in the chart above. It can be observed that the VI gave the quickest signal to sell before MACD confirmation.
Divergence of +VI trendline and price chart
There are two types of divergence of the vortex indicator. They are the bullish and bearish divergence.
Bullish divergence occurs when the positive VI trendline (blue trendline) experiences a higher high whilst the price movement experiences a lower high. Bullish divergence can also serve as a buy signal.
Moreover, an asset is said to have a bearish divergence when the positive VI trendline (blue line) rallies a lower high as the price movement breaks the previous high. This is a sell signal.
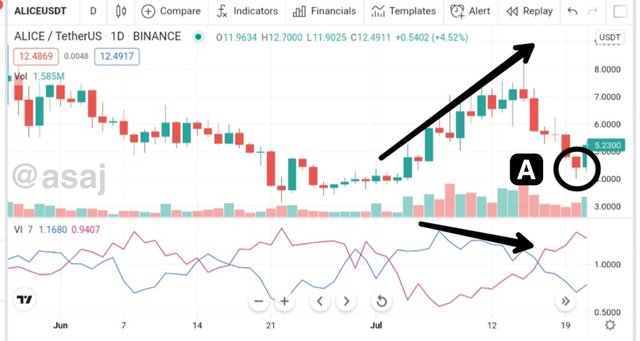
Fig. 13: Bearish divergence of +VI trendline and price chart of ALICEUSDT pair | tradingview.com
A bearish divergence can be observed in the above chart. Notice how price dumped in point A soon after the bearish divergence. This is a good reason why bearish divergence is a sell signal.
Final Words
The vortex indicator is a relatively new tool in the toolkit of traders and technical analysts. It was developed by Etienne Botes and Douglas Slepman in 2010. And it is based on the directional movement of J. Welles Wilder's studies.
We have learnt how to add the VI to a crypto chart and how to configure the indicator. We have also discussed the buy and sell signals of VI. Generally speaking, the vortex indicator is a very useful tool in the hands of a trader, so long as it is tuned correctly.
Homework (S03 • W06)
In your own words explain the vortex indicator and how it is calculated
Is the vortex indicator reliable? Explain
How is the vortex indicator added to a chart and what are the recommended parameters? (Screenshot required)
Explain in your own words the concept of vortex indicator divergence with examples. (Screenshot required)
Use the signals of VI to buy and sell any two cryptocurrencies. (Screenshot required)
Guidelines
Please take note of the following requirements:
Ensure to post your work in the Steemit Crypto Academy community.
Avoid the use of fluffs, filler words, or unnecessary information. The recommended word count is 500 words or above.
Focus on the quality & clarity of your charts and explanations instead of the length of your work.
Plagiarism, content spinning and content farming are prohibited. This task requires screenshot(s) of your own experience. Use images from copyright-free sources and indicate the source, if any.
Homework task submission will start from 00:00 UTC August 2nd to 23:59 UTC August 7th.
Eligible participants must have a reputation of 55 or above, and a minimum SP of 250 (excluding delegated SP). [Must not be powering down]
The title of work should be in this format, Crypto Academy / Season 3 / Week 6 - Homework Post for [@asaj]: Vortex Indicator Strategy
The first tag must be #asaj-s3week6 while the second and third tag should be #cryptoacademy and #vortexindicator. Feel free to use other relevant tags such as your country tag.
Homework can be written in Ukrainian (for native speakers only).
Attempt all questions to get maximum points. Note that a unique presentation of answers will earn you more points.
If you do not understand any part of the homework, please leave a comment below.
Here is my homework
https://steemit.com/hive-108451/@olaspecial/steemit-crypto-academy-or-season-3-or-week-6-homework-post-for-asaj-vortex-indicator-strategy
Hello professor @asaj I have a query regarding the last question.
Do we need to actually buy and sell two Cryptocurrencies in the last question or could it be a demo trade as well?
It is advisable to use a demo account to trade coins when exploring a new indicator.
Thank you professor @Asaj for this lecture. It is easy to understand.
Do you think it would be more effective to choose a 1-day chart when trading?
You always chose 1-day charts.
Thank you for the Lecture @asaj.
Please How do I get a demo account. Thank you
You can get one on tradingview.com by using their Paper Trading. Or simply download the MetaTrader app. You can also sign up on FXCM. So, there are so many options 🤔
Thank you Prof. @asaj
Hello Prof. @asaj, I'm totally confused here. Pls are mine to perform real trades to show the buy or sell signals?
Thanks.
It is not recommended to perform live trades when learning about a new indicator. That is why I suggest using a demo account. Some trading brokers that offer demo accounts are FXCM, Paper Trading, FTX, MetaTrader 4, and MetaTrader 5.
Thanks Prof.
But can I make use of my stormGain demo trade App?
Yes, you can.
Buenas noches profesor. Hago entrega de mi tarea:
https://steemit.com/hive-108451/@leomolina/crypto-academy-s3-w6-or-indicador-vortex
Hello @leomolina, please change the title of your work to Crypto Academy / Season 3 / Week 6 - Homework Post for [@asaj]: Vortex Indicator Strategy
Ready
Here is my homework Professor:
https://steemit.com/hive-108451/@maazmoid123/crypto-academy-season-3-week-6-homework-post-for-asaj-vortex-indicator-strategy
Thank you Professor @asaj for the lecture.
Below is the link to my homework.
https://steemit.com/hive-108451/@msquaretk/crypto-academy-season-3-week-6-homework-post-for-asaj-vortex-indicator-strategy
hello @asaj this is my entry post to this weeks task :
Crypto Academy / Season 3 / Week 6 - Homework Post for [@asaj] // Vortex Indicator