Crypto Academy / Season 3 / Week 6 - Homework Post for [@asaj]: Vortex Indicator Strategy
It is my pleasure to submit this homework task. Professor @asaj has done a very great job. He taught the course "Vortex Indicator Strategy" in a very simple way. Thank you, Prof. That being said. At the end of the lecture, Prof. asked five (5) questions. The questions are highlighted below:
- In your own words explain the vortex indicator and how it is calculated
- Is the vortex indicator reliable? Explain
- How is the vortex indicator added to a chart and what are the recommended parameters? (Screenshot required)
- Explain in your own words the concept of vortex indicator divergence with examples. (Screenshot required)
- Use the signals of VI to buy and sell any two cryptocurrencies. (Screenshot required)
So, these are the questions I will be dealing with in this homework. Follow me closely.

QUESTION 1
In finance trading, one of the thing traders use to predict the movement of price is technical analysis. And technical analysis ranges from the use of candlesticks on the chart and other several technical indicators. So, Vortex indicator is one of the technical indicators used by traders. In this section, I will explain in detail what vortex indicator is.
Detailed Explanation of Vortex indicator
Vortex indicator was invented 10years ago, to be precise in 2010 by two people named Etienne Botes and Douglas Siepman
Vortex indicator is a type of indicator used by traders to determine the direction or predict the movement of price. Simply put, vortex indicator is a trend indicator. It is a trend indicator which indicates reversal of trend, gives the start of a new trend and the continuation of the existing trend depending on the general bias of the market at a particular period of time.
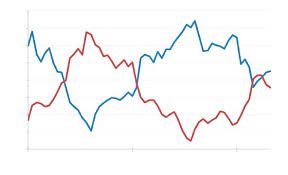
Fig. 1: Vortex indicator
IMAGE SOURCE
The vortex indicator comprises of two lines as it can be seen in the fig. 1. The blue line is known as positive vortex indicator (VI+), while the red line is often reffered to as negative vortex Indicator (VI–). These lines often cross at a certain period. When they cross it usually signifies either buy or sell. When the blue line crosses the red line and move above it, it means the bull are in control of the price. That is, the trend with which seller or bears are coming with is about to change and the investors are investing to buy the asset.
Also, when the red line crosses the blue line and move above, it means the sellers or bears have gained momentum. They have overpowered buyers and can now drag the price of the market down.
The trend, according to this indicator, can be termed positive and negative. The distance between the immediate high and the prior low is often reffered to as positive trend, while the distance between the immediate low and the prior low is known as negative trend.
How Vertex Indicator is calculated
Vertex indicator has three things or parameters in its calculation. They are trend, periods and range.
Trend: Here, upward and downward movement of trend is calculated. The upward movement is calculated by subtracting the previous low from current high [cH – pL]. And the downward movement is calculated by subtracting previous high from current low [cL – pH].
Where:
cH = current High
pL = previous Low
cL = current Low
pH = previous HighPeriods : When using period, it is recommended to choose 14 because it has been said that this period is reliable and gives accurate result. However, depending on one's strategy, you can choose any period you are cool with. It doesn't matter what you choose; what matters is the result you are getting. The period one chooses will often determine the readings of the highs and lows of the downward and upward movement.
range : Here, the true range is calculated. And it is calculated by choosing the maximum out of these:
cH – cL
cL – pC
cH – pC
Where:
cH = current High
cL = current Low
pC = previous Close
QUESTION 2
In this section of the question, I am going to answer based on what I believe about technical indicators.
Just like all other indicators, there two things to them, it is either they work for you or they don't. But to me, most of the times, every indicator, to some extent, works. It would not have been invented if they didn't work. There are things I believe that make indicator fails for traders. One of them is that most traders have not achieved or attained a level of confidence in their trading strategy. Sometimes it is not about the tool we use , it is about how we use it that determines how it will work. So if one has not really known how to use a tool, it will always look like 'it is failing.'
If the traders has not attained some level of psychology, no matter how workable a tool is, it will still be failing in his hands. Psychology is one of the most important things in finance trading. Trading deals with emotion and if one can't control his emotions, he or she is not fit for trading.
Further, risk management of some traders make them to lose and therefore they may be saying some indicators don't work. Whereas, they are the ones who have not really learnt how to manage their funds. If a trader doesn't know how to manage his fund, even if he wins 8 trades out of 12, he can still lose all he has gained. Management of fund is very important and as well as management of trades. What makes some traders to lose their funds is greediness because they haven't learned how to control or curb their greediness.
That being said. Vortex indicator is reliable. Although truth be told, there is no indicator that works 100%. In fact, no strategy works 100%. There will always be a period where false signals will be given. If we are to look at it from another angle, we can say no machine works 100%. In physics or machine design, there is what is known as percentage efficiency, and no machine attains 100% in reality. Also, indicator are tools designed which are not expected to be correct at all times.
This is what I believe. Once an indicator has about 60% success rate, it is reliable. Why? The reason is, with proper risk management and high psychology, one will be profitable.
QUESTION 3
The platform I normally use for analysis is trading view. So, I will be using this platform for this question.
- Firstly, I google search to navigate the website. In the search box, I typed "trading view" then it loaded and brought the website. See the screenshot below.
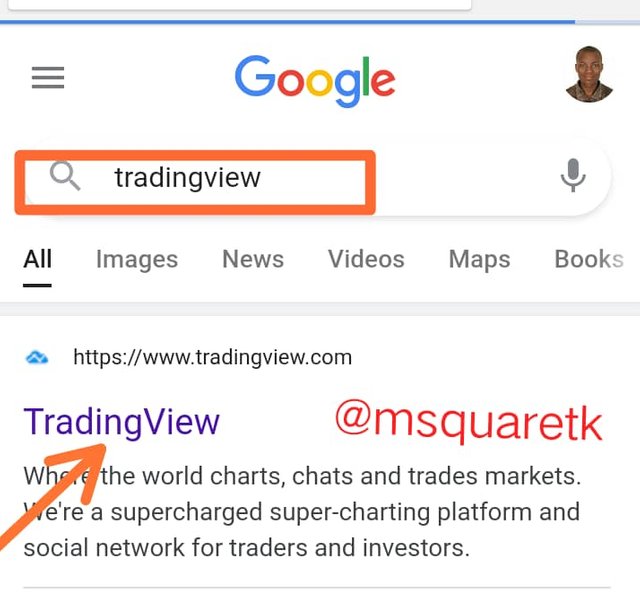
Fig. 2: Google searching the website of Trading view
Then the website of trading view appeared right in my front.
- The next thing to do is to click on the "menu" at the left top side of of the page.
Clicking on this, you are going to see some features show under the menu. - Then, click on the chart so you can be taken to the chart page. See the screenshot below.
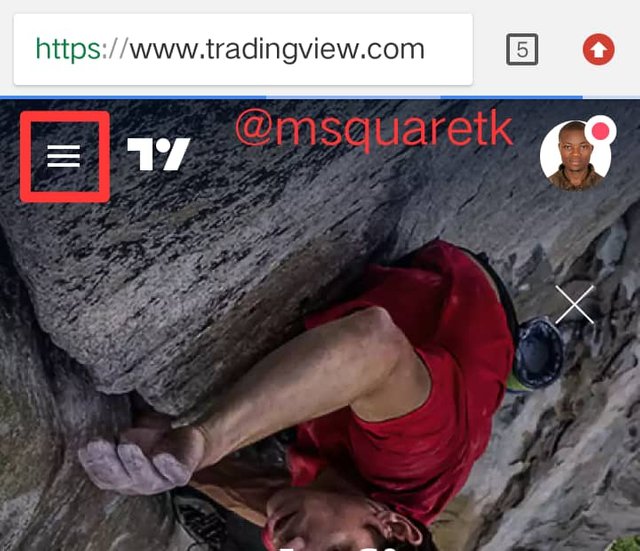
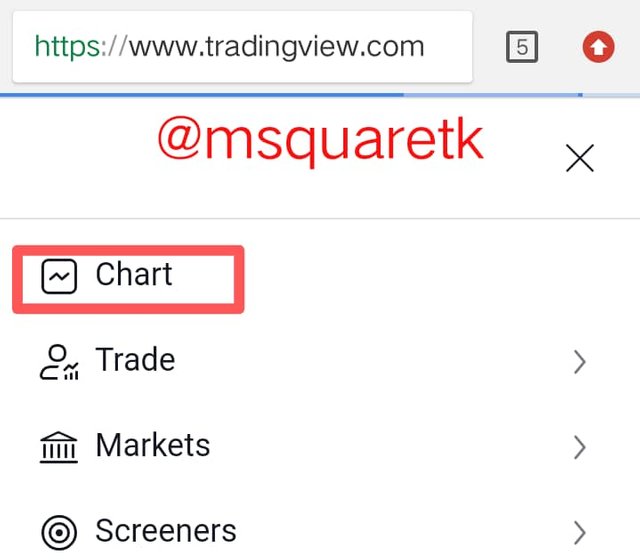
tradingview.com
Then the chart will appear right in front of you. For this exercise, I have decided to use the chart of BTCUSD. However, if you want to analyze different chart, you can change it.
- click on the "BTCUSD" at the left top of the chart and search for the pair you want to analyse. See the screenshot below.
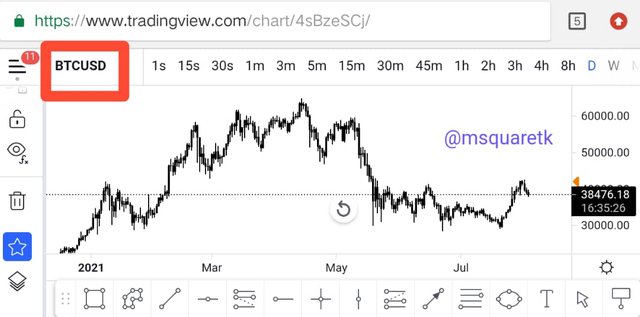
Fig. 4: BTCUSD Chart | tradingview.com
Having said that, let's move on to next thing which is how to see the vortex Indicator and add it to the chart.
- The next thing is to click on the " fx indicators" sign at the top of the chart.
See the screenshot below.
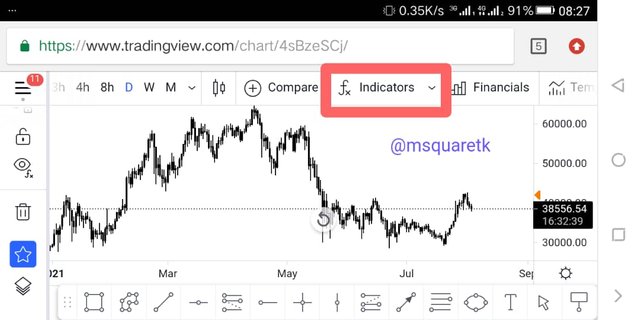
Fig. 5: fx indicators Sign | tradingview.com
A pop up notification will appear as soon as you click the fx indicators icon as in fig. 5. Then what next?
- In the search box of indicators, type "vortex" and once it brings out the results, click on"vortex Indicator".
Let's see the screenshot below.
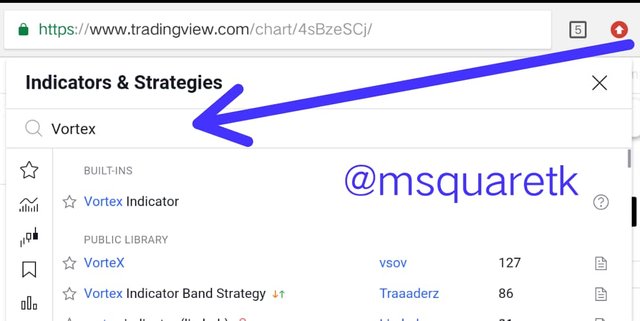
Fig. 6: Fx indicators Search Box | tradingview.com
By clicking on it, the vortex Indicator would be added to the chart. Let's go back to the chart and see if it has been added. See the screenshot below.
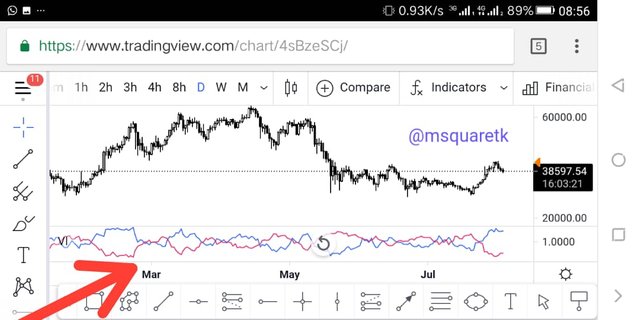
Fig. 7: Vortex indicator on BTCUSD Chart |
tradingview.com
As it can be seen in fig.7, the vortex Indicator has been added. The two lines intersecting below the chart is the vortex Indicator.
So what next. We need to set this vortex Indicator to the desired length. Then how do we do that? Simple!
- Take your mouse and bring the cursor on the vortex Indicator at the bottom of the chart. Clicking it, some features will appear. Click on the setting, the "gear icon." Let's see the screenshot below.
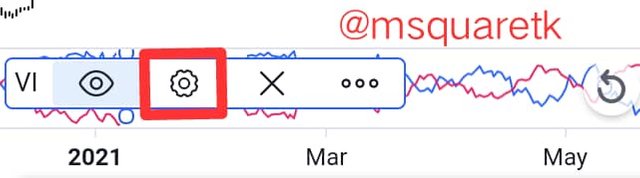
Fig. 8: Vortex Indicator Setting Icon |
tradingview.com
The icon like eye is where to hide the vortex Indicator and the "X" icon is where to close that display. That being said. Let's continue.
After clicking on the setting, a pop up notification will appear where we will can actually set the length, color and many other things. On appearing, you will be taken to the "style" option of the setting first
- Make the the VI + a green color and VI – a red color
Let see the screenshot below.
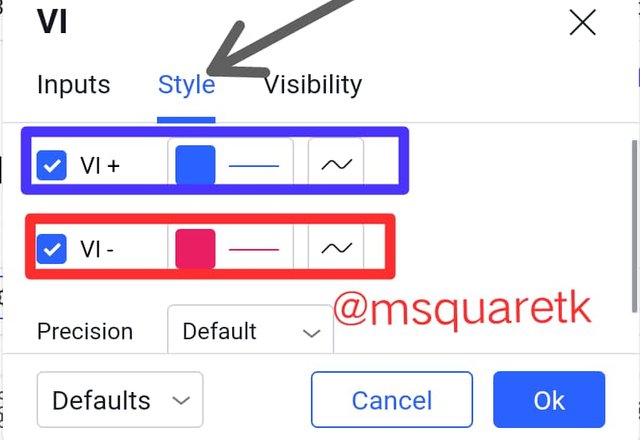
Fig. 9: Style Section of the Setting | tradingview.com
- Click the "inputs" and set the length. For this exercise, I am using "14" as my length which is often the recommended length and indicator timeframe should be set as "same as chart".
Let's see the screenshot below
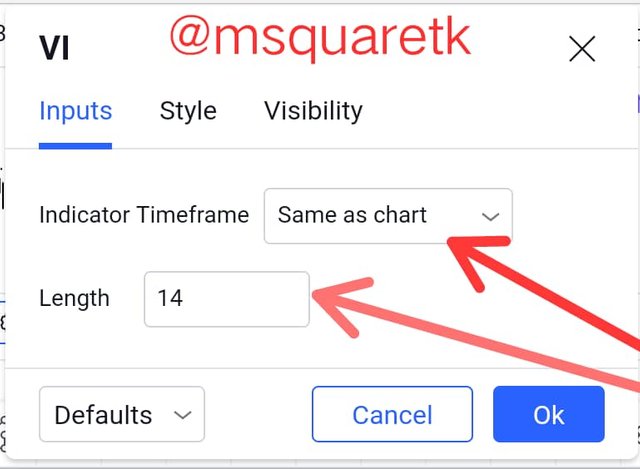
Fig. 10: Inputs Section of the Setting |
tradingview.com
- The next thing is to go to the "visibility section"and set it as default.
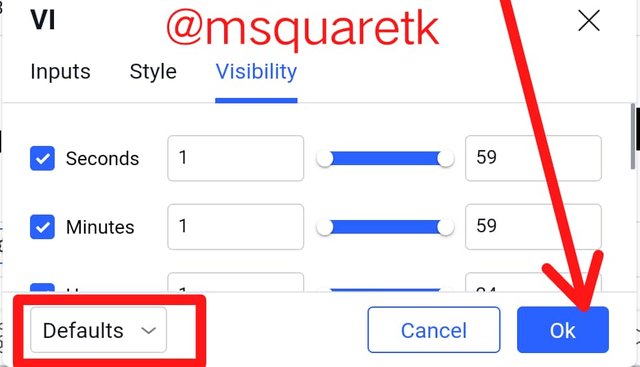
Fig. 11: Visibility Section of the Setting | tradingview.com
Now everything is set and perfect. Let's now go back to our chart.
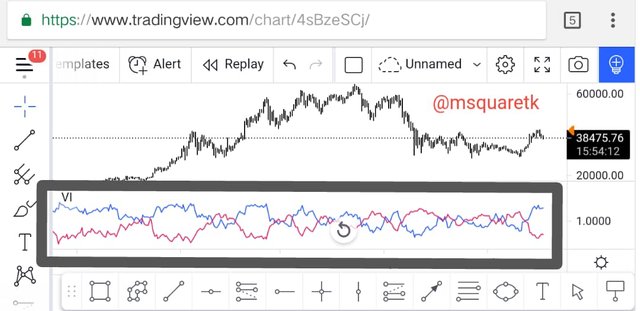
Fig. 12: Vortex Indicator on the Chart |
trading view.com
Recommended Parameters.
The Recommended parameters for vortex Indicator are:
For length or period, 14 period is often recommended. 14 has been tested and proved to have more success rate. But in a ranging market, wider period may be more useful. This is to avoid false signals. However, one can use the period he is cool with depending on his trading style and strategy.
For the color, most traders use blue color for VI+ and red color for VI-. It is not advisable to use the same color. If you notice, you will realize that when color red and blue is used, it's always visible to the sight.
For timeframe, higher time frame is recommended. Just like all other indicators, there's always noise on lower time frame and as such one can be deluded to take wrong and false signals if vortex Indicator is used often on lower time frame. However, traders combine this indicator with other indicators especially when they want to use it on lower time frame.
QUESTION 4
Divergence is of two types when considering vortex Indicator.
- Bullish divergence
- Bearish divergence
Let's start with bullish divergence.
Bullish Divergence
Bullish divergence in vortex Indicator is a buy signal. It occurs when the price makes or forms lower low (LL) and the blue line (VI+) makes a higher low (HL). That's, the price decreases while the VI+ increases. See the screenshot below for a bullish divergence of vortex indicator
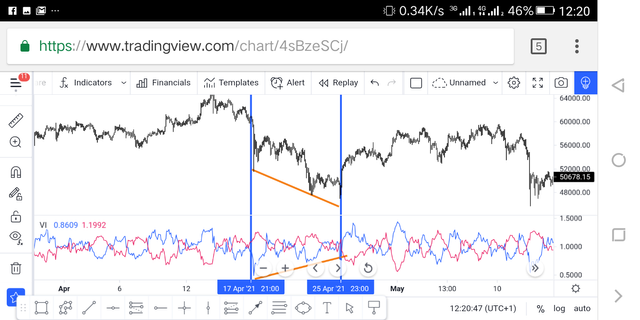
Fig. 13: Bullish Divergence of Vortex Indicator | tradingview.com
As it can be seen in fig. 13, a trendline is connected to the candlesticks from April 17th to April 25th, this shows that the price experiences a fall and a trendline is also connected to the VI+ with the same dates in view, the trend line slant up, this shows that VI+ increases. This is known as bullish divergence. And we can see that, immediately after this formation, the price rally up.
Bearish Divergence
Bearish divergence is a direct opposite of bullish divergence. In bearish divergence, the price makes higher highs and the positive vertex indicator ( VI+) makes lower highs. The signal is often a bearish run. When it forms, buyers actually exit the market and sellers often position themselves in selling the asset. Let see the image of bearish divergence below.
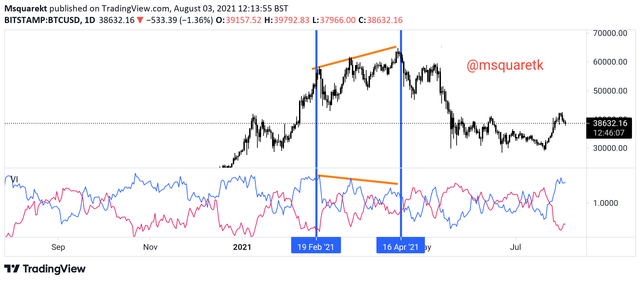
Fig. 14: Bearish Divergence of Vortex Indicator | tradingview.com
In the fig. 14, it can be seen that from Feb. 21st to April 16th, the price rallies up with series of higher highs (HH) indicated by the trendline, but on the vortex indicator, the blue line, positive vortex indicator (VI+) makes lower highs (LH). That is often called bearish divergence.
QUESTION 5
Buy Set Up on BTCUSD
For this exercise, I will be using BTCUSD chart first. I opened my chart and a reversal was spotted on BTCUSD M30 chart. Let's see the screenshot below.
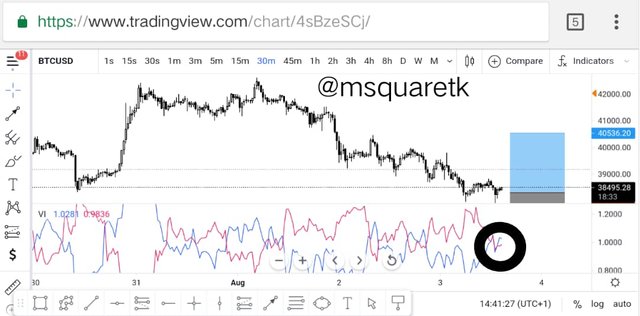
Fig. 15: Buy Analysis, BTCUSD M30 Chart |tradingview.com
The area circled with black color is where the VI+ cross and rally over the VI-. This is a buy signal. And according to the chart, price has been on a bearish trend for sometime, so that confirms that the price may shift in trend. So seeing that we have a cross and that it is buy signal, I opened my MT4 app and I placed an instant buy order. Let's see the screenshot below
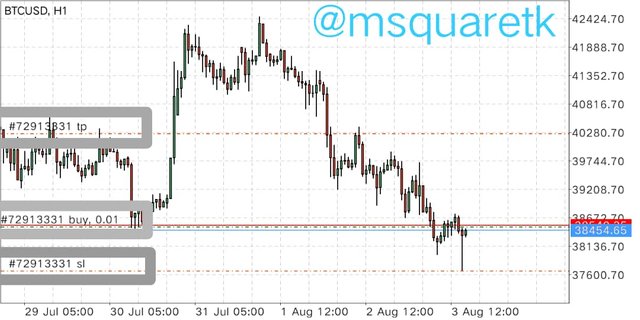
Fig. 16: MT4 BTCUSD Chart | trading view.com
Knowing that BTCUSD is very volatile, I used the smallest lot size, 0.01. I placed the stop loss at the immediate low created and take profit at a nearest supply zone. The risk to reward is about 1:1.5.
After some minutes, I checked back, the price has started moving up. Let's see the screenshot below.
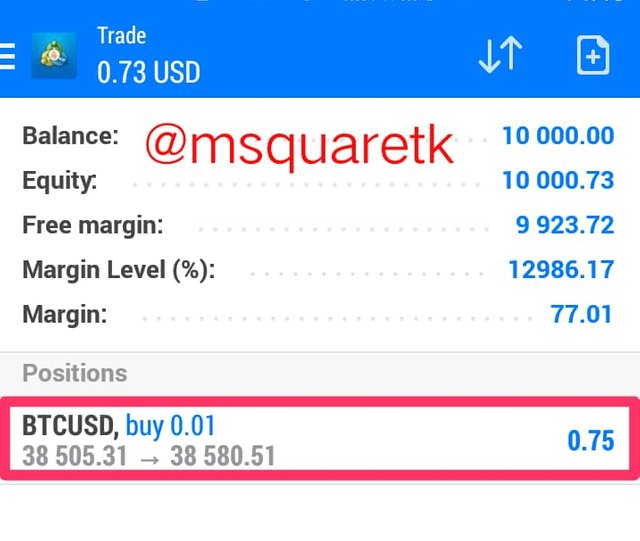
Fig. 17: BTCUSD Trade on MT4
The trade is still running. I will be trailing my stop loss once it moves up a bit.
Sell set Up on ETHUSD
I will be using ETHUSD for the second set up. I opened ETHUSD and spotted reversal on H4 time frame. If it goes according to plan, it's going to be massive. Let's see the chart in the screenshot below.
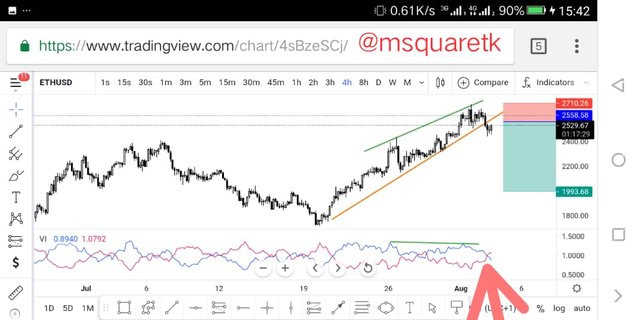
Fig. 18: ETHUSD Chart, H4 TF | tradingview.com
In the fig. 18, ETHUSD has been in uptrend for a while with series of Higher highs. Right now on H4, vortex Indicator has given a sell signal. The blue line which is VI+ crossed the red line VI- and move below. It is further confirmed that the trend may be shifted by the divergence that occurred. Price moves with higher highs identified by green line and positive vortex Indicator VI+ moves with lower high.
So I have placed an instant sell execution. See the screenshot below.
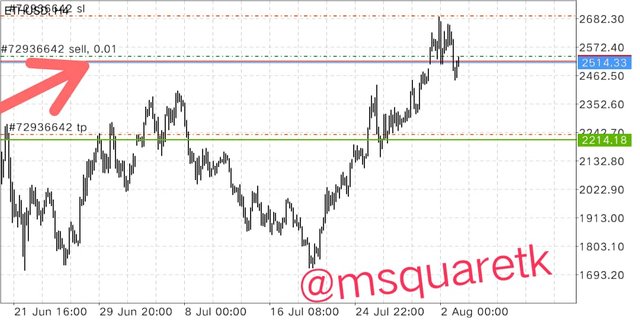
Fig. 19: ETHUSD Trade on MT4
The stop loss is placed above the previous high and the take profit is placed at the nearest demand zone.
CONCLUSION
Vortex Indicator is one of the technical indicators that is used to determine the trend in market. The indicator was invented 10-years ago and since then it has gained popularity in trading stock, cryptocurrency and currency.
I have learnt how to add this indicator to the chart. Not only this, I have also learnt to trade using this technical indicator. The vortex indicator is very powerful but it can be combined with other indicators which will help traders to know the right signal and position themselves for opportunities in market
Thank you Professor @asaj. The lecture added a whole lot to my my trading arsenal.
CC: @asaj
Written by @msquaretk
Superb performance @msquaretk!
Thanks for performing the above task in the sixth week of Steemit Crypto Academy Season 3. The time and effort put into this work is appreciated. Hence, you have scored 9 out of 10. Here are the details:
Remarks
This is a remarkable understanding of the vortex indicator. Apart from a few typos, this work was exceptionally done. Keep it up Micheal!
Thank you Professor @asaj for the review. I'm glad I attended your class.