Steemit Crypto Academy | Season 3 | Week 6 - Homework Post for @asaj: Vortex Indicator Strategy

In your own words explain the vortex indicator and how it is calculated
The vortex indicator (VI) is a technical indicator used to know new or existing trends in the cryptocurrency market. The vortex indicator also uses past price information to forecast trends in the prices of cryptocurrency.
The vortex indicator is comprised of two indicator lines, each takes the place of either positive ( bullish ) or negative ( bearish ) price trends. When formed as part of the vortex indicator, the lines intersect to give a vortex shape. Vortex indicators are used as part of trading strategies developed to forecast bullish or bearish price trends based on existing information. The origins of the VI have to do with the use of price bars.
For example, the daily price bar of Bitcoin would display the highest and lowest prices of Bitcoin assets over a single trading day. The vortex indicator joins the highs of a cryptocurrency price bars with the lows of the following price bar.
Calculating the Vortex Indicator
Calculating the vortex indicator requires five steps:
It requires some steps to calculate vortex indicator.
1 First, you have to calculate the upward and downward movements:
You can calculate the upward movement (VM+) as the current high minus the previous low.
You can calculate the downward movement (VM-) as the current low minus the previous high.
2 You have to calculate the number of periods:
• Assuming you have 50 periods in the vortex indicator, you can calculate it this way
VM50+ = 50 period sum of VM+
VM50- = 50 period sum of VM-
3 You can calculate the True Range (TR) these ways
The maximum of either of the following is the true range.
Current high minus the current low
Current low minus the previous close
Current high minus the previous close
Current high minus the current low
*The above must all be absolute values
4 You can calculate for a certain period:
For 20 periods: TR20 = 20-period Sum of TR
- Calculate VI+ and VI-
VI20- = VM20- / TR20
VI20+ = VM20+ / TR20

Is the vortex indicator reliable? Explain
To be sure whether an indicator is reliable or not one might use it for some time and also test it with other indicator to be sure. With the research I made, I think the only limitation of the Vortex Indicator is that it gives some false signals if you use short-period settings. But if you use the longer-period setting, it will give you little signals, but above all, those signals will be very accurate. For a naive trader, the vortex bullish or bearing divergence might be a little difficult to identify.
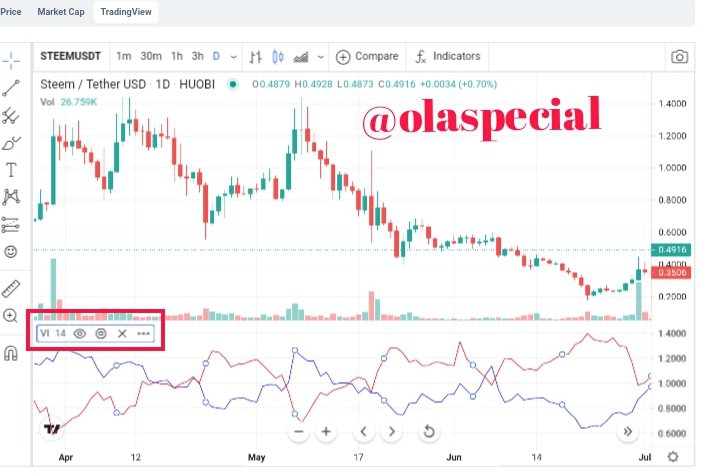
How is the vortex indicator added to a chart and what are the recommended parameters? (Screenshot required)
I will show how to add vortex indicator on your chart.
- I will launch my steem/usdt chart

source
- Click on indicator at the top
 source
- Enter Vortex in the search bar and click on it
 source
- Now we have Vortex indicator add
 source
- Click on Vortex indicator to see the settings
 source
- Click on settings
 source
- The recommended parameter is 14 but can still change it depending of time frame.
 source
- We can also change the colors of the lines
 source
- We can also set the visibility
 source
Explain in your own words the concept of vortex indicator divergence with examples. (Screenshot required)
There is a bearish divergence when prices draw rising highs. The positive VI moves decreasing highs and negative VI moves rising lows.
We can notice a bearish divergence in the chart below
 source
Bullish divergence happens when the +VI trendline undergo a higher high momentum the price movement experiences a lower high.
A bullish divergence also serve as buy signal. We can notice the bullish divergence on the chart below.
 source
Use the signals of VI to buy and sell any two cryptocurrencies. (Screenshot required)
I will like buy XRP using vortex indicator
 source
 source
I will like to sell DOT using vortex indicator signal
 source
 source
This is a very useful strategy, naive traders might need some research and practice to be able to use this indicator effectively. In this strategy, a short sale will be set off and reversed to the long side when the price returns to the higher high after a positive crossover, while a long position will be sold and reversed into a short sale after the price is reversed to the highest low after a negative crossover.
It is also recommended to merge these entry filters with other techniques indicators.
Hi @olaspecial, thanks for performing the above task in the sixth week of Steemit Crypto Academy Season 3. The time and effort put into this work is appreciated. Hence, you have scored 5 out of 10. Here are the details:
Remarks
You have demonstrated a decent understanding of the topic. However, your work did not provide the level of depth we look out for.